
| American Geophysical Union Convention in San Francisco |
Michigan Tech professors and students presented papers at the American Geophysical Union annual meeting. Geology and geological engineering students presented papers on: Gas and ash emissions, Remote Sensing, Seismic Monitoring, Lahar hazards, Volcanic Aerosols, Dome morphology. Travel for the presenters to the AGU Meeting in San Francisco was thanks to: MTU Graduate School, Remote Sensing Institute, and the GMES Department.
 |
 |
 |
 |
 |
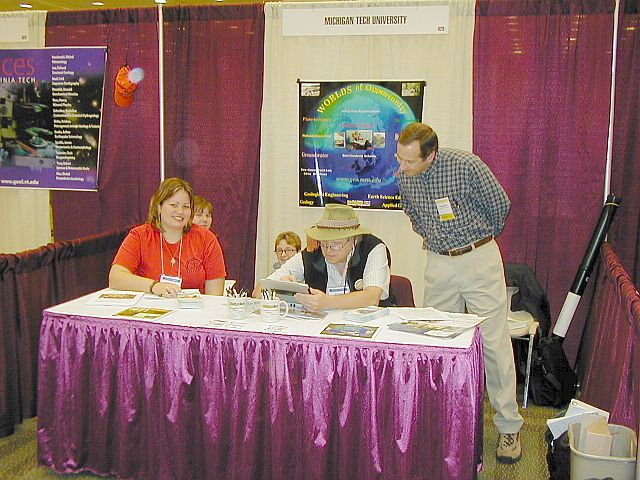
Shown at left is part of the group that attended, these being the volcanology contingent |
 |
 |
 |
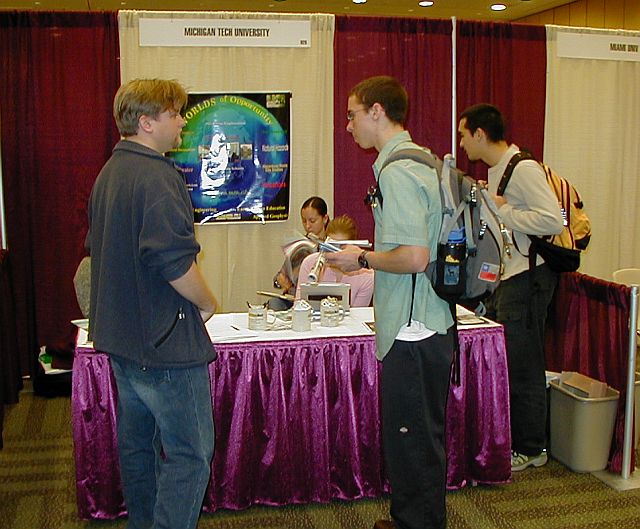 |
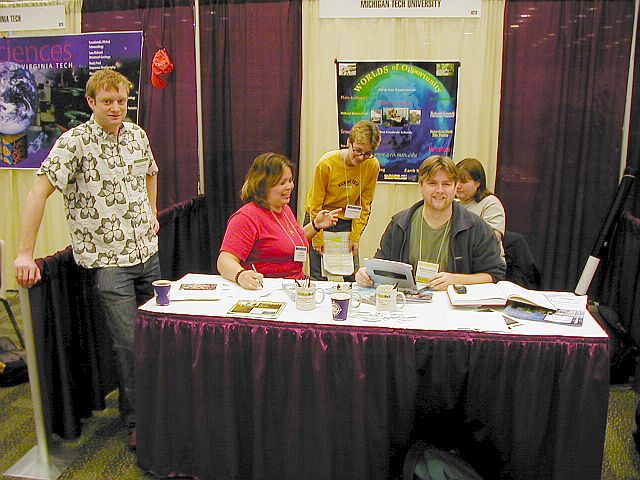
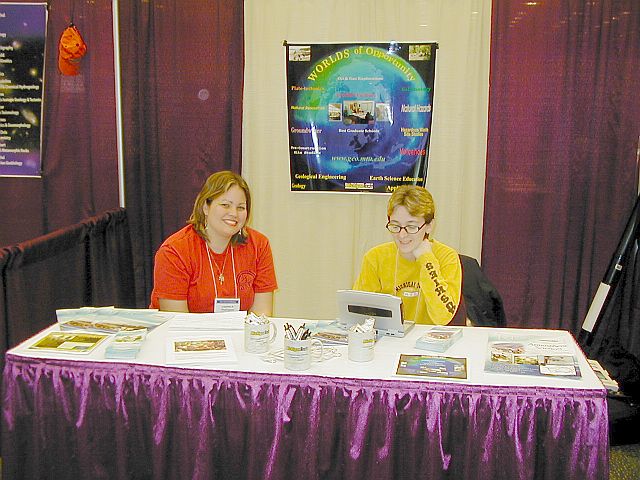
Shown in this series of photos above and left, is the Michigan Tech booth at the AGU convention. | 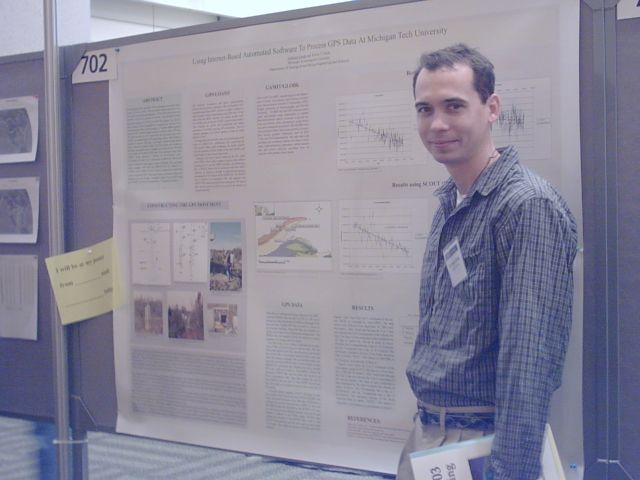 |
Following are the some of the paper titles, names of presenters and the abstracts:
Observing Popocatepetl's Volcanic Clouds Using MODIS Infrared
Data
Matiella, M , Michigan Tech
Delgado-Granados, H, Instituto de Geofisica, Universidad Nacional Autonoma de Mexico, UNAM, Ciudad Universitaria, Coyoacan, Mexico DF, Mexico
Rose, W I, Michigan Tech
Watson, I, Michigan Tech
Popocatepetl Volcano, Mexico, is a tropical volcano with significant
and persistent
emissions of SO2 and ash. These emissions pose significant
hazards to the
large population in close proximity to the volcano and are an important
indicator of
eruptive activity (Love et al., 1998, Nature 396: 563-566). Moderate Resolution
Imaging Spectroradiometer (MODIS) satellite imagery provides us with a
synoptic
perspective of volcanic emissions and atmospheric interactions, information
unavailable from ground-based or aircraft studies, which can be useful
for hazard
mitigation. We report on MODIS data during December 2000 and January 2001
coincident with abundant emissions based on COSPEC data. SO2
masses are
retrieved using the 7.3 mm and 8.6 mm absorption features of SO2
(7.3 $\mu$m method after Prata et al, in press, AGU Volcanism Atmospheric
Monograph; 8.6 mm method after Realmuto et al, 1997, J. Geophys Res 102:
15057-15072). Ash masses are retrieved using silicate absorption features
at 11mm and 12 mm (Wen \& Rose, 1994, J Geophys Res 99: 5421-5431).
Furthermore, this data set tests the accuracy of the algorithms and the
conditions
under which the algorithms work best, and can be compared to COSPEC
measurements taken by Popocatepetl's monitoring team. We found that MODIS
data
often showed more than one volcanic cloud. For example, one MODIS image
collected
January 23rd, 2001, at 0450 UT, shows four large eruptions that have dispersed
volcanic clouds over an extensive area of Mexico. Using upper air data
and monitoring
records, the movements of the 4 ash clouds are fit with eruption times
and winds,
and using retrieval data for SO2 and ash we can derive a time
based SO2
and fine ash emission record. The results of these retrievals compliment
ground-based measurements which cannot measure large scale eruptions.
Using Internet-Based Automated Software to Process GPS Data at
Michigan Tech University
Crook, A, Michigan Tech
Diehl, J F, Michigan Tech
The Michigan Tech University GPS monument was made operational in October
of
2002. The monument, which consists of a concrete pillar extending approximately
10
feet below the surface and protrudes 5 feet above ground, is located at
the
Houghton County Memorial Airport (47.171803 degreesN, 88.498361 degrees
W). The
primary purpose of the monument is to measure the velocity of the North
American
Plate at this location. A Trimble 4000ssi geodetic receiver with a Trimble
Zephyr
antenna is used to collect GPS data. The data are sent to a PC where they
are
processed using Auto-GIPSY, an internet-based GPS processing utility,
which makes
it possible to process GPS data, via email, without having knowledge of
how the
software works. Two Perl scripts were written to facilitate automation
and to simplify
processing of the GPS data even further. Twelve months of GPS data were
processed, using Auto-GIPSY, which produced a velocity of -24 - 5 mm/yr
and
-4 - 6 mm/yr for the X and Y components respectively with an azimuth of
261 degrees with respect to the ITRF2000. This calculated result compares
well with
the NNR-NUVEL1A velocity of -17 mm/yr and -1 mm/yr for the X and Y components
respectively with an azimuth of 267 degrees. The results from an alternative
online
processing service, the Scripps Coordinate Update Tool (SCOUT) that uses
GAMIT,
will also be presented as a comparative method.
Elevated Uranium in Aquifers of the Jacobsville Sandstone
Sherman, H, Michigan Tech
Gierke, J, Michigan Tech
The EPA has announced a new standard for uranium in drinking water of
30 parts per
billion (ppb). This maximum contaminant level (MCL) takes effect for community
water
supplies December 2003. The EPA's ruling has heightened awareness among
residential well owners that uranium in drinking water may increase the
risk of kidney
disease and cancer and has created a need for a quantified, scientific
understanding
of the occurrence and distribution of uranium isotopes in aquifers. The
authors are
investigating the occurrence of elevated uranium in northern Michigan
aquifers of the
Middle Proterozoic Jacobsville sandstone, a red to mottled sequence of
sandstones,
conglomerates, siltstones and shales deposited as basin fill in the 1.1
Ga Midcontinent
rift. Approximately 25% of 300 well water samples tested for isotopic
uranium have
concentrations above the MCL. Elevated uranium occurrences are distributed
throughout the Jacobsville sandstone aquifers stretching across Michigan's
Upper
Peninsula. However, there is significant variation in well water uranium
concentrations
(from 0.01 to 190 ppb) and neighboring wells do not necessarily have similar
concentrations. The authors are investigating hydrogeologic controls on
ground water
uranium concentrations in the Jacobsville sandstone, e.g. variations in
lithology,
mineralogy, groundwater residence time and geochemistry. Approximately
2000' of
Jacobsville core from the Amoco St. Amour well was examined in conjunction
with the
spectral gamma ray log run in the borehole. Spikes in equivalent uranium
(eU)
concentration from the log are frequently associated with clay and heavy
mineral
layers in the sandstone core. The lithology and mineralogy of these layers
will be
determined by analysis of thin sections and x-ray diffraction. A portable
spectrometer, model GRS-2000/BL, will be used on the sandstone cliffs
along Lake
Superior to characterize depositional and lithologic facies of the Jacobsville
sandstone
in terms of concentrations and ratios of eU, eTh and K. Equipped with
borehole
accessories, the spectrometer will be used to log residential drinking
wells to
determine a relationship between the uranium concentration of well water
and the eU
concentration in the sandstone. Tritium/helium-3 dating will be used to
determine
whether ground water uranium concentrations increase with residence time.
PHREEQCI will be used to model dominate aqueous species of uranium and
saturation
indices of uranium minerals.
Analysis of the impact of soil heterogeneity on optimal policies
for groundwater remediation
Bau, D, Michigan Tech,
Mayer, A S, Michigan Tech
Typical groundwater remediation problems involve the design of the number,
location
and flow rate schedule of pumping and injection wells. Simulation models
combined
with optimization models are used to rank alternatives while considering
management
objectives, e.g. minimizing remediation cost and/or maximizing cleanup
efficiency, and
constraints, e.g. the maximum permissible concentrations at selected compliance
sites. Mostly due to both high computational effort required and lack
of data, the
simulation models often are based on simplified 2D homogeneous hydrogeologic
settings. The purpose of this work is to investigate how simplifying hypotheses
may
affect the final optimal remediation policy. In particular, the analysis
addresses the
case of a heterogeneous layered aquifer versus an homogeneous one with
an
equivalent (lumped) hydraulic conductivity. To simulate groundwater flow
and
contaminant transport, use is made of a fully 3D finite element unsaturated
flow
model along with a particle tracking transport code. The flow and transport
code is
then coupled to a genetic algorithm model to optimize the specified objective
function. The problem considered is the remediation of a hypothetical
aquifer-contaminant system using pump and treat. The objective is to minimize
the
cost of the remediation system. The cost function is a nonlinear function
of decision
variables (pumping rates) and state variables (hydraulic heads and contaminant
concentrations). Constraints include limits on hydraulic head and the
contaminant
mass remaining in the aquifer at the end of the remediation. The results
of
homogeneous and heterogeneous simulations are compared in terms of cost
and
values of the decision variables.
Santiaguito Volcano, Guatemala: A Study of Vent Dynamics Over
the Past 50 Years
Head, E M, Michigan Tech
Dalton, M P, Michigan Tech
Bluth, G J, Michigan Tech
Rose, W I, Michigan Tech
October 1902 marked one of the Earth's largest historic eruptions at
Santa Maria
volcano, Guatemala. Since 1922, volcanic dome extrusion has been occurring
on the
southwest flank of Santa Maria from the continuously active Santiaguito
vent
system. Dangerous activity including vertical ash eruptions, avalanches,
lava flows,
and pyroclastic flows has been persistent from Santiaguito, requiring
observations of
the volcano to be carried out from a distance. Consequently, our understanding
of
subsurface processes, such as the shape, size, and position of the magma
body and
conduit systems must be inferred by remote measurements. There may be
a
correlation at Santiaguito between the effects of subsurface conduit dynamics
on
summit vent morphology and subsequent volcanic activity. Our recent observations
have identified the presence of a ring-shaped vent, approximately 150m
wide, within
the Santiaguito summit dome, which is thought to represent the surface
expression of
a series of fractures generated from the conduit at depth. Thus, a time
series of
surface observations of vent geometry and observations of volcanic activity
could
help constrain the near surface conduit evolution. An archive of aerial
photos from
1947 to 2000, photographs of vent activity from 1969 to present, and 11
hours of
digital video from 2002 and 2003 volcanic activity at Santiaguito will
be analyzed to
discover how these observations are related. The objective of this project
will be to
better understand the conduit evolution at Santiaguito volcano by documenting
changes in vent morphology over the last 50 years and to correlate these
findings
with eruptive history. These results can be further correlated with gas,
thermal,
seismic, and other geophysical studies, calculations of dome volume and
dome
dimensions, and predictive modeling of Santiaguito's volcanic activity.
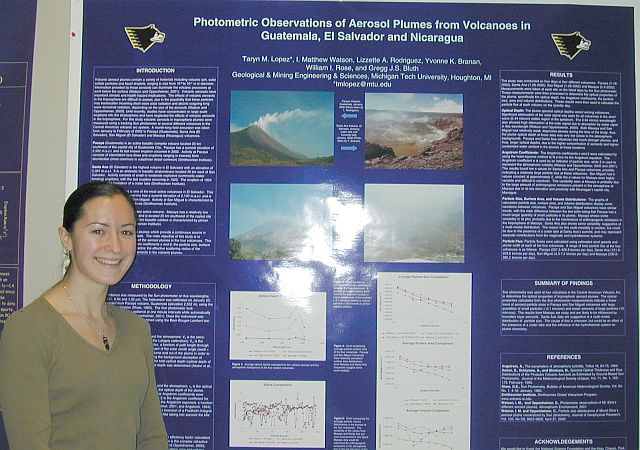
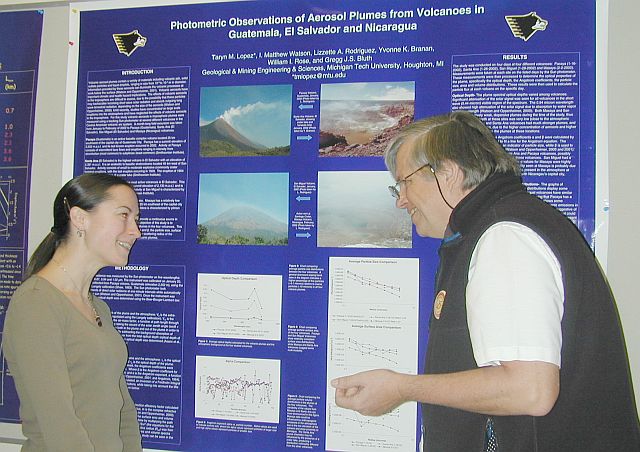
Photometric Observations of Aerosol Plumes From Volcanoes in
Guatemala, El Salvador, and Nicaragua
Lopez, T M, Michigan Tech
Watson, I, Michigan Tech
Rodriguez, L A, Michigan Tech
Branan, Y K, Michigan Tech
Rose, W I, Michigan Tech
Bluth, G J, Michigan Tech
Visible to near infrared sun-photometers were used to measure spectral
optical
depths in order to infer particle size distributions of volcanic aerosols
in plumes from
volcanoes in the Central American arc. Data were taken from the following
volcanoes
on the listed dates in 2002: Pacaya, Guatemala on January 14, 16, 20 and
21; Santa
Ana, El Salvador on January 24 and 26; San Miguel, El Salvador on January
28; and
San Cristobal, Nicaragua on February 3. These volcanoes were chosen for
study
because of: good calibration of the sun-photometer (Pacaya), the presence
(and
effects) of a crater lake (Santa Ana) and a paucity of previous measurements
(San
Miguel and San Cristobal). The optical properties of these tropospheric
volcanic
aerosols will be retrieved after the removal of the background optical
depth. Through
the application of the Angstrom equation and a King-type inversion, the
Angstrom
coefficients, the particle size distribution, and the effective radius
(Reff) will be
determined (Watson and Oppenheimer, 2000; 2001). Through these methods
we hope
to increase the understanding of emission and conversion processes of
tropospheric
volcanic aerosols. We hope the interpretation of these data will help
elucidate
environmental and climatic effects of these aerosols on local to global
scales, and
provide insight into modulation of aerosol emissions through the presence
of a crater
lake.
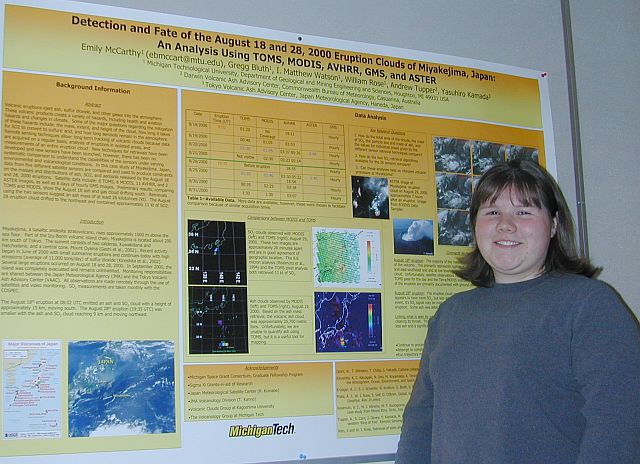
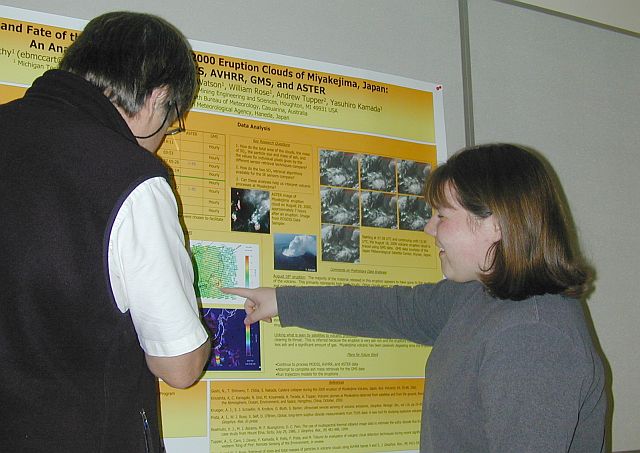
Detection and Fate of the August 18 and 28, 2000 Eruption Clouds of Miyakejima,
Japan: An Analysis Using TOMS, MODIS, AVHRR, GMS, and ASTER
McCarthy, E, Michigan Tech
Bluth, G, Michigan Tech
Watson, I, Michigan Tech
Rose, W, Michigan Tech
Tupper, A, Darwin Volcanic Ash Advisory Centre, Commonwealth Bureau of
Meteorology, Northern
Territory Regional Office, Casuarina, NT 0811 Australia
Kamada, Y, Tokyo Volcanic Ash Advisory Center, Japan Meteorological Agency, Tokyo, Japan
Volcanic eruptions eject ash, sulfur dioxide, and other gases into the
atmosphere.
These volcanic products create a variety of hazards, including health
and aviation
hazards and changes in climate. Some of the major questions regarding
the mitigation
of these hazards include: the mass, extent, and height of the cloud, how
long it
takes for SO2 to convert to sulfuric acid, and how long aerosols
remain in the
atmosphere. Remote sensing techniques allow: long-term tracking of volcanic
clouds
because data are acquired on a regular basis, analysis of eruptions in
isolated areas,
and measurements of an entire eruption cloud. New techniques for retrievals
have
been developed and new sensors have been launched, however, there has
been no
systematic comparison to understand the capabilities of the sensors under
varying
environmental and volcanological conditions. In this case study of Miyakejima,
Japan,
data from five different satellite sensors are compared and used to produce
constraints on the masses and distributions of ash, SO2, and
aerosols released
by the August 18 and 28, 2000 eruptions. Satellite data include: 6 TOMS,
6 MODIS,
11 AVHRR, and 2 ASTER images, as well as 8 days of hourly GMS images.
Preliminary
results, comparing TOMS and MODIS, show the August 18 ash and gas cloud
drifting
south. Retrievals using the two sensors suggest an ash mass of at least
26 kilotonnes
(kt). The August 28 eruption cloud drifted to the northeast and contained
approximately 11 kt of SO2.
Correlation of SO2 Gas Emissions, Seismicity and
Thermal Signals at Santiaguito, Guatemala
Branan, Y K, Michigan Tech
Watson, I , Michigan Tech
Harris, A J, University of Hawai'i, Hawai'i Institute of Geophysics and Planetology
Rose, W, Michigan Tech
Bluth, G J, Michigan Tech
Chigna, G, Insituto Nacional de Sismologia, Vulcanologia, Meteorologia y Hidrologia, Guatemala City, Guatemala
Mota, M, Insituto Nacional de Sismologia, Vulcanologia, Meteorologia
y Hidrologia, Guatemala City, Guatemala
With vertical explosions occurring approximately every 40-50 minutes,
the Santiaguito
dome at Santa Maria Volcano is an ideal system for examining short-term
data
patterns. A 3-week long field experiment was performed in January 2003
at the
Santiaguito Volcano Observatory in order to record high temporal resolution
measurements of volcanic activity. We collected digital seismic data from
a single
vertical component seismometer located approximately 4 km southeast of
the active
Caliente vent. A portable infrared thermal monitoring unit was deployed
daily to
record the temperature of the plume as it left the vent at an acquisition
rate of 300
measurements per minute. A miniature ultraviolet spectrometer (MUSE) was
also
deployed daily to measure the SO$_{2}$ gas emissions just above the vent.
This
instrument is based on the differential optical absorption spectroscopy
(DOAS)
technique and allowed for continuous readings at a rate of 36 measurements
per
minute from approximately 6.5 km south of the Caliente vent. At abstract
time, the
seismic data is not analyzed, but there is a strong correlation between
the SO$_{2}$
emission and thermal data showing that the expulsed gas heats the dome
extensively
as it is emitted, with a possibility of different signatures indicating
certain types of
activity such as pyroclastic flows. It is expected that, with the addition
of seismic
data and the application of analysis of periodicity using Fourier Transforms,
the data
will elucidate conduit processes, providing additional vital constraints
to sub-surface
models.
SO2 loss rates at Lascar volcano, Chile: preliminary results
and interpretations from 2002 measurements
Rodriguez, L A, Michigan Tech
Watson, I, Michigan Tech
Tassi, F, Dipartimento di Scienze della Terra, Universita degli Studi
di Firenze, Firenze,
Italy
Viramonte, J, Instituto GEONORTE, Facultad de Ciencias Naturales, Universidad Nacional de Salta, Buenos Aires, Salta, Argentina
Poodts, M, Instituto GEONORTE, Facultad de Ciencias Naturales, Universidad Nacional de Salta, Buenos Aires, Salta, Argentina
Rose, W I, Michigan Tech
Bluth, G J, Michigan Tech
The measurement of volcanic SO2 emission rates is commonly performed
on
cross sections of the plume some distance downwind from the active vent,
some
time after its interaction with other volcanogenic gases (primarily water),
particles
and droplets of volcanogenic and/or meteoric origin, and atmospheric gases.
The
emission rates being measured therefore do not necessarily represent the
real fluxes
emitted by the volcano; instead they are underestimated due to the conversion
of
SO2 to SO4 (Oppenheimer et al., 1998). Near source
plume
chemistry is not well understood, but can have significant effects on
climatologically
active species, which is why it is important to quantify volcanic SO2$
conversion rates as a function of meteorological environment and plume
age. A
mini-UV spectrometer and a Microtops II sun photometer were used to measure
SO2 emission rates and aerosol particle size distributions
at Lascar volcano,
Central Andes, during the months of October and November 2002. Direct
gas
measurements from fumaroles in the crater were made on November 1. These
represent the first gas samples ever collected directly in the crater.
Lascar volcano
represents one of the end-members of the environmental spectrum, being
a high
volcano (summit altitude at 5600 meters above sea level) in a dry atmosphere
(average 15). Its location allows for simultaneous near-vent and downwind
measurements at similar altitudes. Here we present our preliminary results
from
November 2, 2002, taken at a variety of azimuthal angles (effective distances
from
the plume) from the vent downwind to about 20 km, during a two-hour period
(0900-1100 local time). This represents a time downwind of up to 42 minutes,
based on a plume speed of 8 m/sec. Initial interpretations and correlations
with
the direct measurements are also presented. The data obtained from a Kestrel
4000
weather station will help clarify the effects of Lascar's high, dry, and
extremely
transmissive atmosphere upon SO2 conversion rates.
Landsat TM and ETM+ Time Sequence of Lahar Hazards on Fuego Volcano,
Guatemala
Reif, S L, Michigan Tech
Bluth, G J, Michigan Tech
Rose, W I, Michigan Tech
Matias, O, INSIVUMEH, Guatemala, Guatemala
Volcanic hazards pose a threat to a large number of the world's population,
especially
secondary hazards due to remobilization of volcanic material such as landslides
and
lahars. Many hazard-prone areas would benefit by remote sensing tools
for hazard
mitigation. In this study, we propose to use remote sensing and GIS techniques
to
map these hazard prone areas around Fuego volcano, Guatemala and provide
information to local organizations to assist in mitigation. Fuego is a
steep sided
volcano with a history of large eruptive events, including the well-studied
1974
eruption, that have extruded a large amount of material onto the upper
reaches of its
watersheds. The volcano is well studied, but historically more emphasis
has been
placed on eruption processes. A study of the way material moves down Fuego
and to
the extent that it moves is needed to help mitigate the range of potential
hazards.
We propose an in-depth remote sensing survey to map the hazard-prone areas.
The
study will consist of processing 20 years (15 cloud-free images) of Landsat
TM and
ETM+ data to look at changes in landforms and vegetation. Vegetation indices
will be
calculated to locate areas devoid of vegetation and a masking process
will be used
These area changes will be related to field measurements to create GIS
to measure
the area of these zones. layers denoting geometry changes in the channels
around
Fuego. These changes will be loaded into a GIS, along with regional climate
data,
DEMs, hydrologic data, infrastructure, and information about the known
volcanic
activity recorded in the area by the local volcanologists. Modeling of
lahars using
LAHARZ and climate data will also be done to determine an estimate of
the amount of
material moved and to what distances it can be transported. A field survey
undertaken in January 2003 acquired GPS ground truth data of landslide
boundaries
and channel volumes for the GIS. The deposits that were seen in the channels
10 km
from the source of the sediment ranged in thickness from 1.5-8 m.
Forward modeling of volcanic aerosols transmissions at different latitudes; quantifying the effects of varying tropospheric water vapor on ash detection.
Watson, I M, Michigan Tech
Rose, W I, Michigan Tech
Realmuto, V J, Visualization and Scientific Animation Group, Jet Propulsion Laboratory, Pasadena, CA
Bluth, G J, Michigan Tech
Current algorithms for volcanic ash cloud detection by satellite, based
upon a
difference in transmissivity of silicate ash at 11 and 12 microns, are
subject to
significant and yet poorly quantified modulation by atmospheric water
vapor. In order
to investigate these effects we have written an aerosol forward model,
based upon
Mie-scattering code, and embedded it in a MODTRAN-based atmospheric radiative
transfer model. This facilitates investigation of errors associated with
inverse
solutions derived from satellite data, and more importantly for this study,
can be used
to vary the atmosphere within which a hypothetical volcanic ash cloud
is contained.
We have taken images of the most well parameterized ash clouds of the
satellite age,
the sequence of eruptions of Mt. Spurr in mid to late 1992, and applied
the forward
model to predict transmission spectra of the ash clouds. Calculations
were performed
for the ash clouds both within the cloud's original atmosphere and within
that of a
sequence of eruptions of Soufriere Hills Volcano, Montserrat, in the British
West
Indies in the late 1990s. Preliminary results indicate a +1-3.5 K brightness
temperature difference (BTD) effect associated with increasing the temperature
and
water vapor content of the atmosphere. This translates to a significant
loss of
detectability in terms of cloud area; up to half the area of the clouds
no longer have
a negative brightness temperature difference, and an effect on reducing
the optical
depth and mass of the cloud. In most cases there was very good agreement
between
the 'clear ocean' BTD and the modeled effect, suggesting a potential source
of
in-image calibration for detection algorithms. In terms of mass and optical
depth
retrievals however, it is obvious that both 11 and 12 micron channel radiances
are
affected by the presence of water vapor, clearly indicating the need for
atmospheric
correction before quantifying the size or concentration of ash in clouds
from satellite
data.
Volcanic SO2 Emissions vs. Seismicity - July 2002 LP Swarm, Soufriere
Hills Volcano, Montserrat
Shannon, J, Michigan Tech
Bluth, G, Michigan Tech
Edmonds, M, Montserrat Volcano Observatory, Fleming, Montserrat, W. Indies
Thompson, G, British Geological Survey, Keyworth, Nottingham, NG125GG United Kingdom
Volcanic sulfur dioxide (SO2) measurements of passive plumes have recently
improved
with the application of Differential Optical Absorption Spectroscopy (DOAS).
In
January 2002, the Montserrat Volcano Observatory installed two fixed DOAS
instruments which collect rapid, continuous measurements of SO2 emissions.
For the
first time, SO2 fluxes are being collected on a time scale of minutes,
allowing
short-term changes to be evaluated with respect to atmospheric transport,
surface
activity, and magmatic source mechanisms. In this study, we investigate
relationships
between SO2 emissions and seismicity for July 2002 at Montserrat. The
seismic data
consist of rockfall, long-period rockfall, hybrid, and long-period (LP)
waveforms.
Seismic energy increased slowly throughout July, culminating in a swarm
of
long-period earthquakes. The SO2 data used for this study consist of measurements
collected every 4-5 minutes from approximately 8 a.m. to 5 p.m. daily
by a DOAS
instrument positioned at Lovers Lane (~4.5 km west of vent). From July
1-18,
seismicity is dominated by rockfalls with intermittent hybrids and LPs.
During this
time, SO2 fluxes generally increase and coincide with an increasing trend
in the
number of rockfalls per day. Average daily SO2 fluxes range from 140 to
1256
tonnes/day with an average of 616 tonnes/day. On July 19, however, the
average
daily SO2 flux decreases from a monthly maximum of 1256 tonnes/day to
227
tonnes/day and continues to average only 326 tonnes/day from July 20-30.
July 19
marks a seismic transition into a LP earthquake swarm that continues into
August.
After the LP swarm begins and SO2 fluxes decrease, however, the number
of daily
rockfalls remains relatively high. Therefore, it appears that LPs are
more strongly
linked to SO2 emissions than rockfall activity. Future work will involve
investigating
short-term (minutes/hours) relationships between seismicity and SO2 emissions.
Quantifying Volcanic Emissions of Trace Elements to the Atmosphere:
Ideas Based on Past Studies
Rose, W I, Michigan Tech
Extensive data exist from volcanological and geochemical studies about
exotic
elemental enrichments in volcanic emissions to the atmosphere but quantitative
data
are quite rare. Advanced, highly sensitive techniques of analysis are
needed to
detect low concentrations of some minor elements, especially during major
eruptions.
I will present data from studies done during low levels of activity (incrustations
and
silica tube sublimates at high temperature fumaroles, from SEM studies
of particle
samples collected in volcanic plumes and volcanic clouds, from geochemical
analysis
of volcanic gas condensates, from analysis of treated particle and gas
filter packs)
and a much smaller number that could reflect explosive activity (from
fresh ashfall
leachate geochemistry, and from thermodynamic codes modeling volatile
emissions
from magma). This data describes a highly variable pattern of elemental
enrichments
which are difficult to quantify, generalize and understand. Sampling in
a routine way
is difficult, and work in active craters has heightened our awareness
of danger, which
appropriately inhibits some sampling. There are numerous localized enrichments
of
minor elements that can be documented and others can be expected or inferred.
There is a lack of systematic tools to measure minor element abundances
in volcanic
emissions. The careful combination of several methodologies listed above
for the
same volcanic vents can provide redundant data on multiple elements which
could
lead to overall quantification of minor element fluxes but there are challenging
issues
about detection. For quiescent plumes we can design combinations of measurements
to quantify minor element emission rates. Doing a comparable methodology
to
succeed in measuring minor element fluxes for significant eruptions will
require new
strategies and/or ideas.
Integration of Seismic and Video Records of Eruptive Activity
on Santiaguito Volcano, Guatemala
Dalton, M P, Michigan Tech
Head, E M, Michigan Tech
Bluth, G J, Rose, Michigan Tech
W I, Molina, E, INSIVUMEH, Guatemala City, Guatemala
Toorongian, J E, Michigan Tech
Santiaguito is a long-lived, dacitic volcanic dome complex, which has
now been
continuously active since 1922. The volcano's longevity is thought to
be related to a
large magma body and the pattern of extrusion is notably unsteady. Direct
observations of activity are inhibited by logistics, such as cloudy weather
at proximal
vantage points after mid morning. Activity observable at Santiaguito each
morning
includes multiple vertical explosions, dome and flow collapses leading
to block and
ash flows or rock avalanches, steam exhalations and fumarolic discharges.
These
phenomena were recorded on digital video from an excellent vantage point
(the
summit of Santa Maria) located 1200 m above and 2.5 km NE of the active
Caliente
Vent of Santiaguito for about three hours on the morning of January 11,
2003, and
from El Brujo Vent, located $\sim$200 m below and 1.2 km W for about four
hours on
the morning of January 9, 2003. The volcano is also ismically monitored,
and we have
synchronized the video with digital seismic data processed through the
Seisan
computer program. Our expected result is a correlated record of seismic
data and
visually-identified eruptive activity, allowing us to evaluate eruption
characteristics.
This will be in the form of a digital video of surface activity on Santiaguito
with
corresponding seismic signals, which will be applicable for education
and scientific
analysis. By correlating seismic signals to eruptive activity, monitoring
agencies that
are distant from the volcano can better interpret the incoming seismic
data, and
communicate a more complete picture of volcanic activity to the surrounding
communities. It also allows us to go back through the seismic record from
Santiaguito
and catalog past eruptive activity. A synchronized seismic and eruptive
activity
video is also a valuable educational/ outreach tool. With the technique
for correlating
video and seismic records established, additional types of data (such
as temperature
and gas readings) can be compared as well.
Modeling Of LARSE II Refraction Data In The Western Mojave Desert,
California
Lim, K, Michigan Tech
Lim, K., USGS, 345, Menlo Park, CA
Baher, S, USGS, 3 Menlo Park, CA
Fuis, G, USGS, Menlo Park, CA
The major goals of the LARSE II (Los Angeles Region Seismic Experiment,
Part II) are
to image the subsurface in Los Angeles region utilizing reflection and
refraction
surveys, to understand the detailed structure of the subsurface in relation
to
earthquakes. LARSE II data acquisition was accomplished in October 1999
along the
150km long main line that extended from Santa Monica Bay to the western
Mojave
Desert. We modeled LARSE II refraction data in the western Mojave Desert
using a
forward modeling technique, fitting the first arrivals in most cases less
than 0.05
second. In general, layers were modeled to match the breaks in slope of
the first
arrival branches. Three layers over basement were modeled. They have velocities
or
velocity ranges (in km/s) of 1.0 or less (Layer 1), 2.0-3.4 (Layer 2)
and 3.3-3.9
(Layer 3). Preliminary interpretations are as follow: Layer 1, up to 0.2km
thick, is
unsaturated, unconsolidated Quaternary sediments. Layer 2 and 3, which
thicken to
a total of 1.5km in the central Mojave Desert, are Quaternary and Tertiary
sedimentary rocks. An oil-test well in the southern Mojave Desert bottoms
at the
base of Layer 3 (1.04 km depth) in the Tertiary rocks. An oil-test well
in the northern
Mojave Desert bottoms in the basement (quartz diorite) at the depth of
1.01km.
Upward steps in basements can be seen on the north and south sides of
the western
Mojave Desert, at or near mapped faults. In summary, maximum depth to
basement is
1.7 km in the western Mojave Desert.
TOMS and Volcanic SO2: an Important aid to the Understanding
of Volcanism and the Atmosphere
Rose, W I, Michigan Tech
Bluth, G J, Michigan Tech
It is impossible to measure gas fluxes from the ground in a major volcanic
event, but
the TOMS instrument provided the first quantitative measurements of individual
stratospheric eruptions, because SO2 could be measured as well
as O3.
The measurements were quickly noticed by scientists, because the masses
of sulfur
erupted often far exceeded what they expected to find, based on petrology
and its
supposed constraints, by surprising factors of 10 to 100. This result
is still not well
understood, and is an important driving idea for volcanologic research.
TOMS was
applied globally and the explosive volcanic flux of SO2 to
the atmosphere was
compiled for the first time using direct measurements --an important input
to earth
systems analysis. Comparison of TOMS volcanic cloud SO2 maps
with infrared
volcanic ash cloud maps showed that there is often spatial separation
of gas-rich
volcanic clouds emplaced higher in the atmosphere and ash-rich clouds
which are
lower and which drift in different directions because of windshears. Sequential
examination of TOMS data showed that SO2 masses in volcanic
clouds
increases for 24 hours or more after eruption. The best explanation of
this increase is
that ice which forms early in volcanic clouds captures SO2
which is then
released again as the stratospheric ice sublimes. The presentation will
document all
of the best examples of the discoveries listed above. Volcanologists and
those
interested in the mitigation of volcanic cloud hazards have repeatedly
suggested that
geostationary SO2 and ash sensing capability at higher spatial
resolution would
provide important new science opportunities. The sensors of the next remote
sensing
era (MODIS, ASTER, SEVIRI, OMI, ABI) bring us closer to achieving these
goals.
The Role of TOMS in Understanding the Fates of Volcanic Emissions
Bluth, G J, Michigan Tech
Rose, W I, Michigan Tech
Guo, S, Michigan Tech
Carn, S , JCET, University of Maryland Baltimore County, Baltimore, MD
The Total Ozone Mapping Spectrometer (TOMS) has observed over 100 eruption
s
during the past 25 years, from both explosive and effusive sources. The
four TOMS
instruments (Nimbus-7, Meteor, ADEOS, and Earth Probe) have gen erated
an
unprecedented archive of eruption data and allowed us to look at processes,
in
addition to describing individual events. The TOMS sensors are less affected
by
atmospheric water vapor and optical thickness than i nfrared techniques,
and thus
are able to return information on the cloud f rom it's early, most concentrated
form,
to dilute cloudmasses several days later. From the many observations and
advances
generated from TOMS data, here we document those which pertain to the
first few
days following emis sion into the atmosphere. Following discrete eruption
events, we
have observed that the mass of retr ieved SO2 often increases for 1-2
days,
independent of any volcanic contri bution. Combining TOMS with other sensor
data
suggests that significant S O2 is sequestered by ice in the rising plume.
Ablation of
the ice slowly re-releases SO2, which results in the apparent increase.
After 2-3
days, this process appears to be largely complete, and SO2 removal then
follows an
exponential decay rate. TOMS-derived removal rates of SO2 have ranged
from
approximately 25 days (e-folding time) for Pinatubo-sized eruptions, to
less than one
day for smaller or tropospheric eruptions. Within the sa me eruption this
rate may
vary, as SO2 removal is strongly affected by ads orption onto co-existing
ash and ice
particles. The removal processes can also be linked to an eruption height
threshold,
separating eruptions whic h are emplaced above the tropopause and produce
potentially long-lasting a tmospheric impacts from those which are rapidly
removed
from the atmospher e. We have also observed that many eruptions produce
a vertical
separatio n of gas-rich and ash-rich phases. However, other events have
produced
no separation, suggesting that the separation may be linked to the eruption
dynamics
or an early, gas-enriched pulse rather than a post-eruption, grav itational
process.
Optimization of Engineering Design of Subsurface Environmental
Remediation Systems: Development and Testing of Community Benchmark Problems
Mayer, A S, Michigan Tech
Miller, C T, Center for the Advanced Study of the Environment Department
of Environmental Sciences
and Engineering University of North Carolina, Chapel Hill, NC
It is well established that the design of economically efficient subsurface
remediation
systems can benefit from the joint use of formal optimization and simulation
models.
It is also well known that obtaining the optimal solution for such designs
is usually
difficult and computationally expensive, due to the characteristic nonlinear,
nonconvex nature of the solution spaces. We believe that more rapid progress
on
optimal design methods might result from both improved methods of evaluation
and
comparison of existing methods on realistic problems and from the investigation
of
novel methods not yet studied in subsurface remediation field. This work
responds to
these needs. We have designed a set of systematic test problems to be
attacked by
the engineering and mathematics community, as a means for benchmarking
and
comparing optimization approaches. The test problems pose many of the
difficulties
anticipated in solving real-world problems such as (a) mixed continuous
and integer,
nonlinear objective functions, (b) the combination of boundary conditions
and system
parameters gives rise to complex relationships between the objective function,
the
decision variables, the constraints, and the state variables, (c) evaluation
of the
objective function is based on solving model equations that are difficult
to solve
accurately and quickly; and (d) the number and range of decision variables
is
potentially enormous. The physical problems include water supply design
problems in
freshwater and freshwater-saltwater systems, a contaminant plume capture
zone
design problem, and a contaminant plume pump-and-treat design problem.
Problem
domains are specified in terms of hydraulic conductivity distributions-
from
homogeneous domains to spatially-correlated random fields- and in terms
of confined
vs. unconfined conditions. Each problem is specified completely in mathematical
and
numerical terms, but sufficient flexibility is allowed to provide for
a wide range of
problem solution approaches. For example, the user is free to select a
flow and
transport simulator and to specify spatial and temporal discretizations.
This paper will
describe the test problems and initial results.
Lost in Loess: Paleomagnetic investigation into loess and tephra
deposits in interior Alaska
Semler, L, Michigan Tech.,
Arnold, K E, Dept. of Geology, Hamilton College, Clinton, NY
Williams, D, Dept. of Geography and Geology, Indiana State Univ., Terre Haute, IN
Morton, J, Dept. of Geology, College of William and Mary, Williamsburg, VA
Layer, P W, Geophysical Institute, Univ. of Alaska Fairbanks, Fairbanks, AK
Stone, D B, Geophysical Institute, Univ. of Alaska Fairbanks, Fairbanks, AK
Beget, J, Geophysical Institute, Univ. of Alaska Fairbanks, Fairbanks, AK
Schaefer, J , Alaska Div. of Geological and Geophysical Surveys, Fairbanks,
AK
As a part of a NSF-funded Research Experience for Undergraduates (REU)
program
at the University of Alaska Fairbanks, loess and tephra samples were collected
at a
road cut near Tok, Alaska, to determine if the site was suitable for paleoclimate
reconstruction of the Pleistocene. Oriented cubes and cores were obtained
from a
section of loess just below the Sheep Creek tephra dated at 190 $\pm$
20 ka,
through the Tetlin tephra (1.2 meters below the Sheep Creek tephra) dated
at 630
$\pm$ 50 ka to two meters below the Tetlin tephra. The accumulated amount
of
loess between dated tephra layers suggests a span of more than one million
years
for the whole section assuming a constant sedimentation rate for the loess.
The
samples were measured for natural remanent magnetization (NRM) and magnetic
susceptibility before magnetic cleaning techniques (Alternating Field
Demagnetization
and Thermal Demagnetization) were employed. Samples were analyzed using
a
cryogenic magnetometer. The demagnetizations show stable magnetic vectors
and
demonstrate that loess is a reliable paleomagnetic recorder. At Tok, we
found that
the entire section is of normal polarity and shows no sign of the 780
ka
Brunhes-Matuyama polarity reversal, which was expected to be 42 cm below
the
Tetlin tephra. Absence of the reversal may be due to discontinuities or
other
changes in the sedimentation rate in the loess, a problem with the sampling
methods, or incorrect ages of the tephras. Based on our studies, we feel
that
changing rates of loess deposition or other unseen discontinuities are
the reason the
reversal was not found. Because of the uncertainty of the depositional
history of the
Tok loess, this section is not useful for obtaining a continuous record
of ancient
climate.
Back To News page
Department of Geological & Mining Engineering & Sciences
Michigan Technological University
1400 Townsend Drive - Houghton, MI 49931-1295
(906) 487-2531