
| Home |
| Research |
| Publications |
| Teaching |
| Graduate Students |
| ------------- |
| PIRE Project |
| Volcanology at MTU |
| PCMI |
| SPOT Lab |
| MTU GMES Dept. |
|
|
Current Research (as of late 2008 - update on the way)A model for the spatially-varying stress field at Yellowstone Volcano Crustal P-Wave Speed Structure Under Mount St. Helens From Local Earthquake Tomography Published ResearchSeismic evidence for fluid migration accompanying subsidence of the Yellowstone caldera
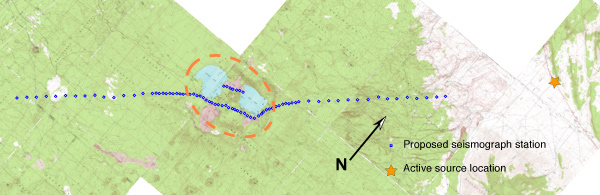
We propose to deploy a temporary seismic array across Newberry Volcano to record reflections off of the geophysically-identified magma body underlying the volcano. Characterizing the size, depth, and percentage of melt in a magma-rich volume is critical for assessing the hazard posed by a volcano. But imaging magma systems with seismic techniques is difficult because they are anisotropic, highly attenuating, and seismic waves tend to refract around them. Theoretical waveform modeling and seismological surveys, however, show that low-incidence-angle reflections from explosive sources produce energetic P and S-wave signals from contacts with large impedance contrasts, such as the top of a magma-rich body. We propose to test this technique by taking advantage of previously planned explosions near Newberry Volcano in central Oregon. Newberry is an important target for study due to the high hazard it poses for Bend, Oregon and surrounding communities. The existence of a previously planned, National Science Foundation (NSF) funded, active-source seismic survey designed to study the structure of the adjacent High Lava Plains in eastern Oregon, affords us a unique opportunity to investigate this promising technique for minimal cost.
A model for the spatially-varying crustal stress field at Yellowstone Volcano
Crustal P-Wave Speed Structure Under Mount St. Helens From Local Earthquake Tomography
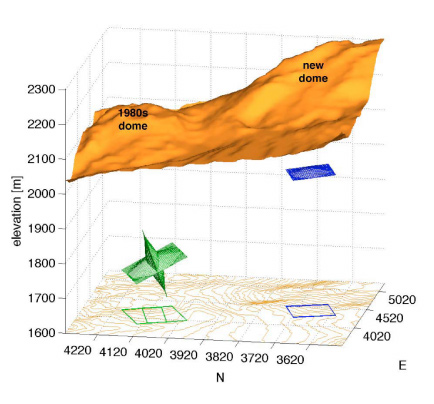
We used local earthquake data to model the P-wave speed structure of Mount St. Helens with the aim of improving our understanding of the active magmatic system. Our study used new data recorded by a dense array of 19 broadband seismographs that were deployed during the current eruption together with permanent network data recorded since the May 18, 1980 eruption. Most earthquakes around Mount St. Helens during the last 25 years were clustered in a narrow vertical column beneath the volcano from the surface to a depth of about 10 km. Earthquakes also occurred in a well-defined zone extending to the NNW from the volcano known as the St. Helens Seismic Zone (SHZ). During the current eruption, earthquakes have been confined to within 3 km of the surface beneath the crater floor. These earthquakes apparently radiate little shear-wave energy and the shear arrivals are usually contaminated by surface waves. Thus, we focused on developing an improved P- wave speed model. We used two data sources: (1) the short-period, vertical-component Pacific Northwest Seismograph Network and (2) new data recorded on a temporary array between June 2005 and February 2006. We first solved for a minimum one-dimensional model, incorporating the Moho depth found during an earlier wide-aperture refraction study. The three-dimensional model was solved simultaneously with hypocenter locations using the computer code SIMULPS14, extended for full three-dimensional ray shooting. We modified the code to force raypaths to remain below the ground surface. We began with large grid spacing and progressed to smaller grid spacing where the earthquakes and stations were denser. In this way we achieve a 40 km by 40 km regional model as well as a 10 km by 10 km fine-scale model directly beneath Mount St. Helens. The large-scale model is consistent with mapped geology and other geophysical data in the vicinity of Mount St. Helens. For example, there is a zone of relatively low velocities (-2% to -5% lower than background model) from 3 to at least 10 km depth extending NNW from the volcano parallel to the SHZ. The low-wave- speed zone coincides with a linear magnetic low, the western edge of a magnetotelluric conductive anomaly, and a localized gravity low. The coincidence of the volcano and these anomalies indicates this preexisting zone of weakness may control the location of Mount St. Helens, as has been suggested by previous investigators. Prominent high-wave-speed anomalies (+3% to +6% relative to background) on either side of this zone are due to plutons, which are also imaged with other geophysical data. Fine-scale modeling of the upper crust directly beneath Mount St. Helens reveals subtle structures not seen in the larger-scale model. The key structure is a cylindrical volume with speeds almost 10% slower than the background model extending from 6 to at least 10 km depth. The vertical, cylindrical volume of earthquakes, which reaches from the surface to more than 10 km depth, splits around this low-wave-speed volume creating an aseismic zone coincident with the low P-wave speeds. We interpret this volume as a melt-rich reservoir surrounded by hot rock. Click here for a preprint. TopThe current eruption at Mount St. Helens is characterized by dome-building and shallow, repetitive, long-period (LP) earthquakes. Waveform cross-correlation reveals remarkable similarity for a majority of the earthquakes over periods of several weeks. Stacked spectra of these events display multiple peaks between 0.5 and 2 Hz that are common to most stations. Lower-amplitude very-long-period (VLP) events commonly accompany the LP events. We model the source mechanisms of LP and VLP events in the 0.5 - 4 s and 8 - 40 s bands, respectively, using data recorded in July 2005 with a temporary broadband network. The source mechanism of the LP events includes: 1) a volumetric component modeled as resonance of a gently NNW-dipping, steam-filled crack located directly beneath the active part of the new dome and within 100 m of the crater floor and 2) a vertical single-force attributed to movement of the overlying dome. The VLP source, which also includes volumetric and single-force components, is 250 m deeper and NNW of the LP source, at the SW edge of the 1980s lava dome. The volumetric component points to the compression and expansion of a shallow, magma-filled sill, which is subparallel to the hydrothermal crack imaged at the LP source, coupled with a smaller component of expansion and compression of a dike. The location, geometry and timing of the sources suggest the VLP and LP events are caused by perturbations of a common crack system.
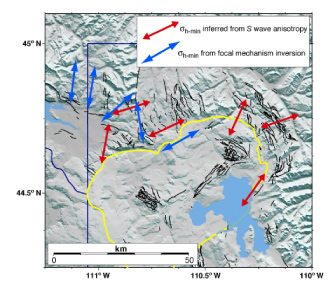
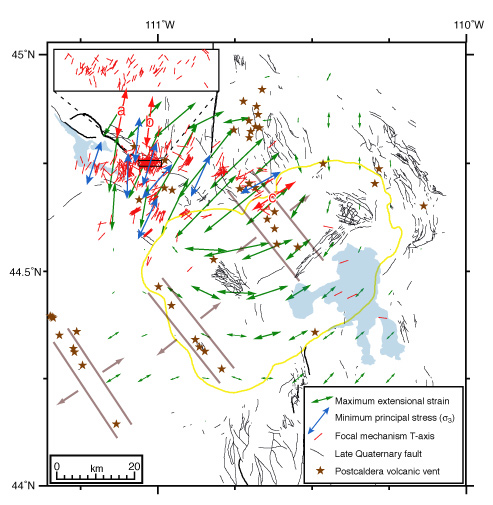
Click here for a reprint. TopThe movement of the lithosphere over a stationary mantle magmatic source, often thought to be a mantle plume, explains key features of the 16 Ma YellowstoneSnake River Plain volcanic system. However, the seismic signature of a Yellowstone plume has remained elusive because of the lack of adequate data. We employ new teleseismic P and S wave traveltime data to develop tomographic images of the Yellowstone hot spot upper mantle. The teleseismic data were recorded with two temporary seismograph arrays deployed in a 500 km by 600 km area centered on Yellowstone. Additional data from nearby regional seismic networks were incorporated into the data set. The VP and VS models reveal a strong low-velocity anomaly from 50 to 200 km directly beneath the Yellowstone caldera and eastern Snake River Plain, as has been imaged in previous studies. Peak anomalies are 2.3% for VP and 5.5% for VS . A weaker, anomaly with a velocity perturbation of up to 1.0% VP and 2.5% VS continues to at least 400 km depth. This anomaly dips 30° from vertical, west-northwest to a location beneath the northern Rocky Mountains. We interpret the low-velocity body as a plume of upwelling hot, and possibly wet rock, from the mantle transition zone that promotes small-scale convection in the upper 200 km of the mantle and long-lived volcanism. A high-velocity anomaly, 1.2% VP and 1.9% VS , is located at 100 to 250 km depth southeast of Yellowstone and may represent a downwelling of colder, denser mantle material. Click here for a reprint. TopTeleseismic shear wave splitting measured at 56 continuous and temporary seismographs deployed in a 500 km by 600 km area around the Yellowstone hot spot indicates that fast anisotropy in the mantle is parallel to the direction of plate motion under most of the array. The average split time from all stations of 0.9 s is typical of continental stations. There is little evidence for plume-induced radial strain, suggesting that any contribution of gravitationally spreading plume material is undetectably small with respect to the plate motion velocity. Two stations within Yellowstone have splitting measurements indicating the apparent fast anisotropy direction (φ) is nearly perpendicular to plate motion. These stations are 30 km from stations with parallel to plate motion. The 70° rotation over 30 km suggests a shallow source of anisotropy; however, split times for these stations are more than 2 s. We suggest melt-filled, stress-oriented cracks in the lithosphere are responsible for the anomalous orientations within Yellowstone. Stations southeast of Yellowstone have measurements of oriented NNW to WNW at high angles to the plate motion direction. The Archean lithosphere beneath these stations may have significant anisotropy capable of producing the observed splitting. Click here for a reprint. TopWe have found spatial variations in seismic stress indicators at the Yellowstone volcanic field, Wyoming, by examining source mechanisms of 25 years of network-recorded earthquakes, 1973-1998. Yellowstone seismicity is characterized by swarms of earthquakes (MC< 3) within the 0.64 Ma Yellowstone caldera and between the caldera and the eastern end of the 44-km-long rupture of the 1959 MS7.5 Hebgen Lake earthquake. We relocated more than 12,000 earthquake hypocenters using three-dimensional velocity models. Focal mechanisms calculated for 364 earthquakes, carefully selected for location accuracy, reveal predominantly normal faulting; however, fault orientations vary across the Yellowstone caldera. Specifically, focal mechanism T axes trend N-S in the vicinity of the Hebgen Lake earthquake fault zone NW of the Yellowstone caldera and rotate to ENE-WSW 35 km east of there. This rotation of the T axis trends occurs in the area of densest seismicity north of the caldera. Stress inversions performed using earthquake first-motion data reveal a similar pattern in the minimum principal stress orientations. The extension directions derived from the focal mechanisms and stress inversions are generally consistent with extension directions determined from geodetic measurements, extension inferred from alignments of volcanic vents within the caldera, and extension directions determined from regional normal faults. The N-S trending Gallatin normal fault north of the caldera is a notable exception; we find extension to be perpendicular to the direction of past extension on the Gallatin fault in the area immediately south of it. We interpret this N-S extension north of the caldera to be related to postseismic viscoelastic relaxation in the upper mantle and lower crust following the Hebgen Lake earthquake. The dominantly extensional tectonic regime at Yellowstone inferred from these results demonstrates the influence of NE-SW Basin and Range extension in this area.
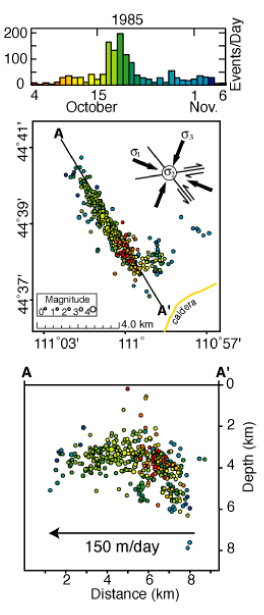
Click here for a reprint. TopSeismic evidence for fluid migration accompanying subsidence of the Yellowstone caldera Seismicity of the Yellowstone volcanic field, northwest Wyoming, is characterized by swarms of earthquakes (MC < 3) within the 0.64-Myr-old, 70 km by 40 km Yellowstone caldera and between the caldera and the eastern end of the 44-km-long rupture of the MS7.5 1959 Hebgen Lake, Montana, earthquake. Over 3000 earthquakes with MC < 5 were recorded during the largest historic swarm that spanned >3 months beginning in October 1985. The swarm had unusual characteristics indicative of interaction between seismicity and hydrothermal/magmatic activity: (1) the swarm followed the reversal of caldera-wide uplift of up to 1 m from 1923 to 1984 to subsidence; (2) swarm hypocenters occupied a nearly vertical northwest trending zone, and during the first month of activity, the pattern of epicenters migrated laterally away from the caldera at an average rate of 150 m/d; (3) the dominant focal mechanisms of the swarm were oblique-normal to strike-slip contrasting with the normal-faulting mechanisms typical of the region; and (4) the maximum principal stress axis averaged for the swarm events was rotated 90° from that of the normal background seismicity, from vertical to horizontal with a trend 30° from the strike of the plane defined by the swarm. We examined analytic models that best fit the focal mechanisms and the orientation of the plane defined by the swarm and found that the temporal shift of earthquake activity could be explained by the migration of hydrothermal fluids radially outward from the Yellowstone caldera following rupture of a sealed hydrothermal system within the caldera.
Click here for a reprint. Top |
||||||||||
Last modified: 28 March 2012 16:53 |