 Geo-engineering
 Michigan Tech
 | Home | Research | Teaching | Group | AEG Student Chapter | Department Profile |
GeoHazard | GeoResource
RUSLE Soil Erosion Model
Datasets for furthering the precision of RUSLE soil erosion with PSInSAR data: An innovative model
Supplementary MaterialCitable reference:
Mapped Landslides from Valles Marineris, Mars
This study created a robust landslide inventory of 682 incidents by collation of data from different sources, apart from our own mapping. This inventory consists of 141 debris flows, 291 rock avalanches, and 250 slumps. This classification was based on the available literature, and these landslides covered Hebes, Ophir, Candor, Melas, Coprates, Ius and Tithonium chasmas.
Landslide ShapefileCitable reference: Rajaneesh. A., Vishnu, C. L., Oommen, T., Rajesh V.J., & Sajinkumar, K. S. (2022). Machine learning as a tool to classify extra-terrestrial landslides: A dosier from Valles Marineris, Mars. Icarus, 114886.
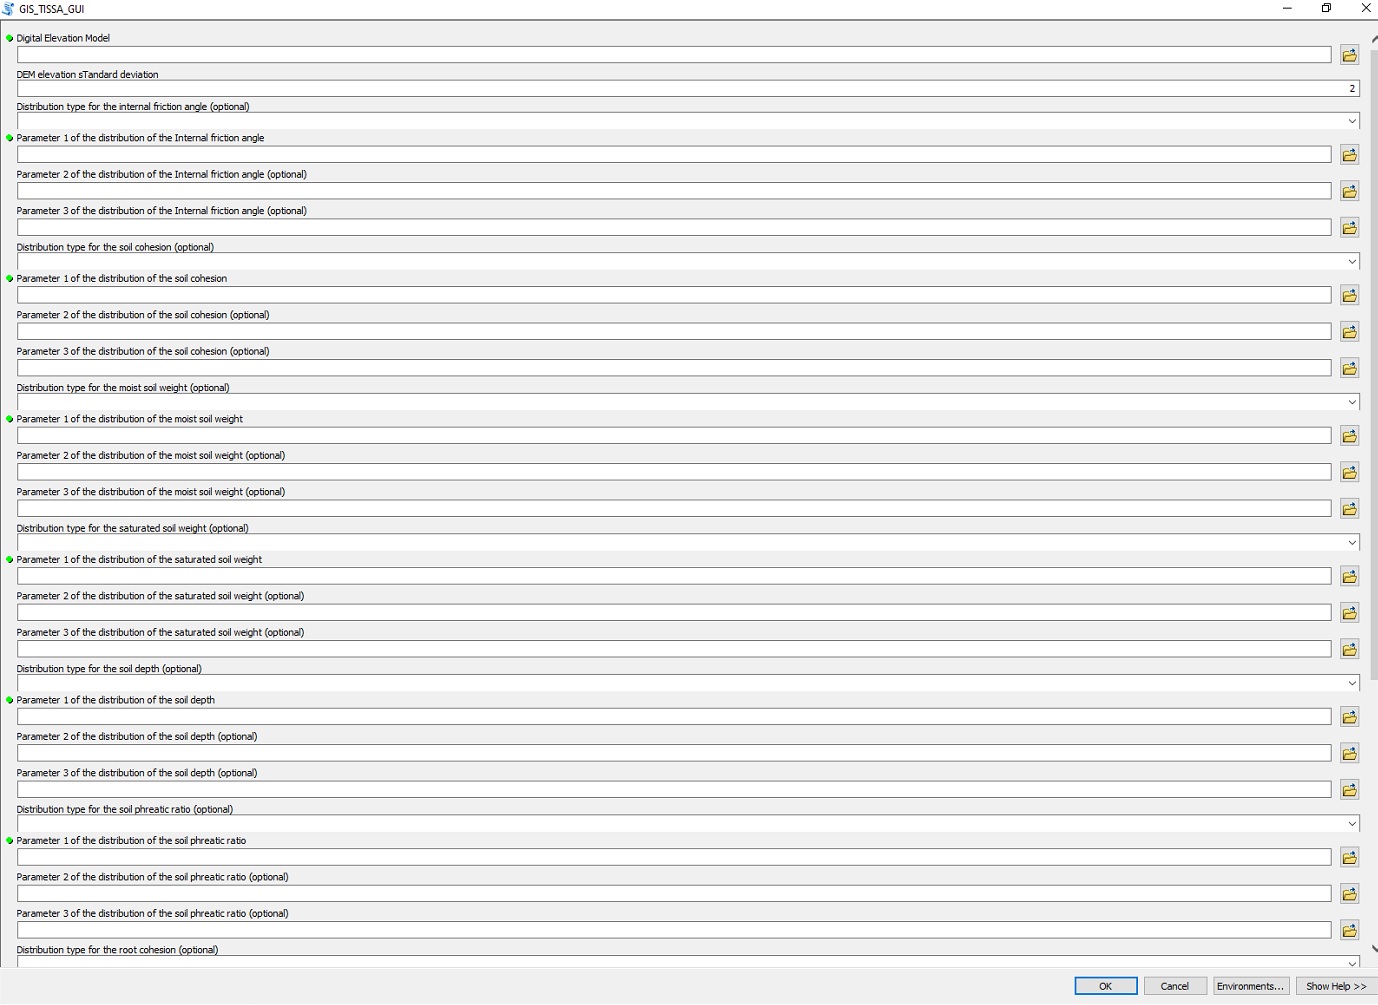
GIS-TISSA: GIS Tool for Infinite Slope Stability Analysis, India
We present an AcrPy implementation of PISA-m algorithms, which can be run from ESRI ArcMap in a fully consistent georeferenced framework, and which we call “GIS Tool for Infinite Slope Stability Analysis” (GIS-TISSA). This tool can be used for slope stability analysis.
GIS TISSA Arc ToolboxGIS TISSA test data in CSV format
GIS TISSA test data for GUI format
GIS TISSA test data description
Citable reference: Escobar-Wolf, R., Sanders, J. D., Vishnu, C. L., Oommen, T., & Sajinkumar, K. S. (2021). A GIS tool for infinite slope stability analysis (GIS-TISSA). Geoscience Frontiers, 12(2), 756-768.
2018 August Kerala Floods, India
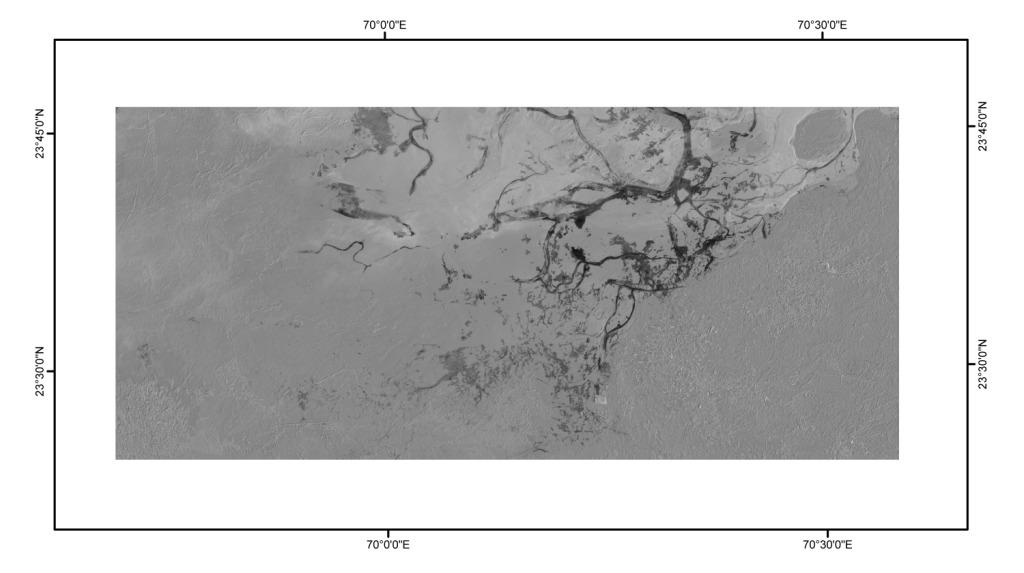
A joint team of researchers from the University of Kerala and Michigan Technological University, US, have come out with an inundation map using satellite images to assess the extent of flooding that caused widespread devastation in Kerala last month. The team comprising Sajin Kumar, Assistant Professor, and Vishnu C.L., Research Associate, University of Kerala, and Thomas Oommen, Associate Professor, Michigan Technological University, used the data from the European Space Agency's radar satellite Sentinel to map the inundated areas in Kerala during and following the floods. The map shows that the wetlands consisting of low-lying Kuttanad in the south, the kole lands of Thrissur in the north, and the backwater system experienced significant increase in water level owing to the floods triggered by torrential rain. While the floodwaters in most of the inundated land had already begun receding by August 21, the water level in Kuttanad and the kole lands were slow to decrease.Part of the flood map is shown below. Contact us for more detail on the flood map.
Documenting Liquefaction Failures Using Satellite Remote Sensing
Earthquake induced liquefaction is a major cause of structural and lifeline damages around the world. Documenting these instances of liquefaction is extremely important to help earthquake professionals to better evaluate design procedures, and enhance their understanding of liquefaction processes. Currently, after an earthquake event, field-based mapping of liquefaction remains sporadic due to inaccessibility, and difficulties in identifying and mapping large aerial extents. Researchers have used change detection using remotely sensed pre- and post-event satellite images to assist field reconnaissance. However, general change detection is only a first step in developing effective field reconnaissance strategies for liquefaction due to the inherent assumption of the approach that all the change observed within the two dates are induced by the liquefaction. We hypothesize that as liquefaction occurs in saturated granular soils due to an increase in pore pressure, the liquefaction related terrain changes should have an associated increase in soil moisture with respect to the surrounding non-liquefied regions. Mapping the increase in soil moisture using pre- and post-event images that are sensitive to soil moisture is suitable for identifying areas that have undergone liquefaction. We verify this by change detection of pre and post- event Landsat ETM+ tasseled cap wetness images. The results indicate that satellite remote sensing can be an integral part in regionally documenting liquefaction failures.
 Change detection showing increased wetness asociated with liquefaction derived by principal component analysis of pre- and post-event Landsat ETM+ tasseled cap wetness images (Jan 2001 & Feb 2001) |
Empirical Liquefaction Models
Empirical Liquefaction Models (ELMs) are the standard approach for predicting the occurrence of soil liquefaction. These models are typically based on in situ index tests, such as the Standard Penetration Test (SPT) and Cone Penetration Test (CPT), and are broadly classified as deterministic and probabilistic models. No objective and quantitative comparison of these models has been published. Similarly, no rigorous procedure has been published for choosing the threshold required for probabilistic models. This paper provides (1) a quantitative comparison of the predictive performance of ELMs, (2) a reproducible method for choosing the threshold that is needed to apply the probabilistic ELMs, and (3) an alternative deterministic and probabilistic ELM based on the machine learning algorithm, known as Support Vector Machine (SVM). Deterministic and probabilistic ELMs have been developed for SPT and CPT data. For deterministic ELMs, we compare the "simplified procedure", Bayesian updating method, and the SVM models for both SPT and CPT data. For probabilistic ELMs, we compare the Bayesian updating method with the SVM models. We compare these different approaches within a quantitative validation framework. This framework includes validation metrics developed within the statistics and artificial intelligence fields that are not common in the geotechnical literature. We incorporate estimated costs associated with risk as well as with risk mitigation. We conclude that (1) the best performing ELM depends on the associated costs, (2) the unique costs associated with an individual project directly determines the optimal threshold for the probabilistic ELMs, and (3) the more recent ELMs only marginally improve prediction accuracy thus efforts should focus on improving data collection.
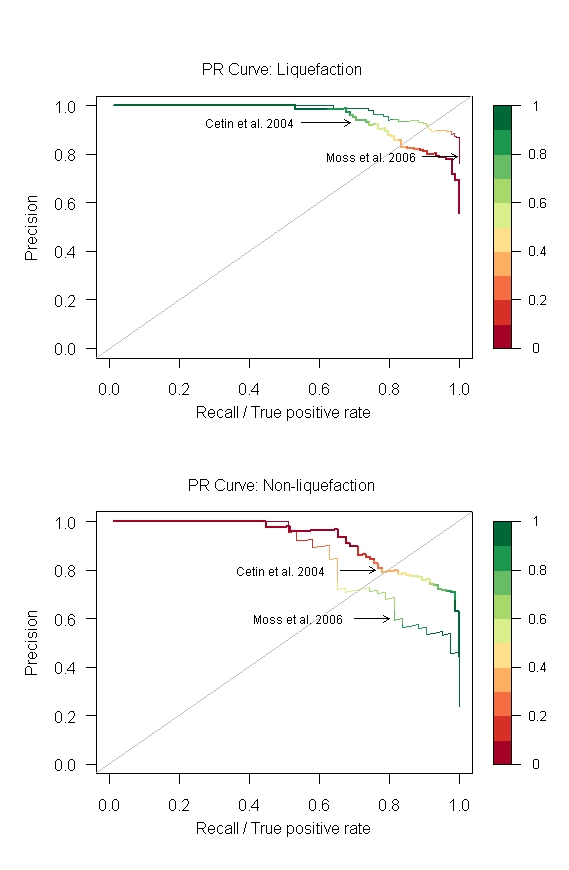 Comparison of P-R curve for the Moss et al. (2006) and Cetin et al.(2004) probabilistic ELMs |
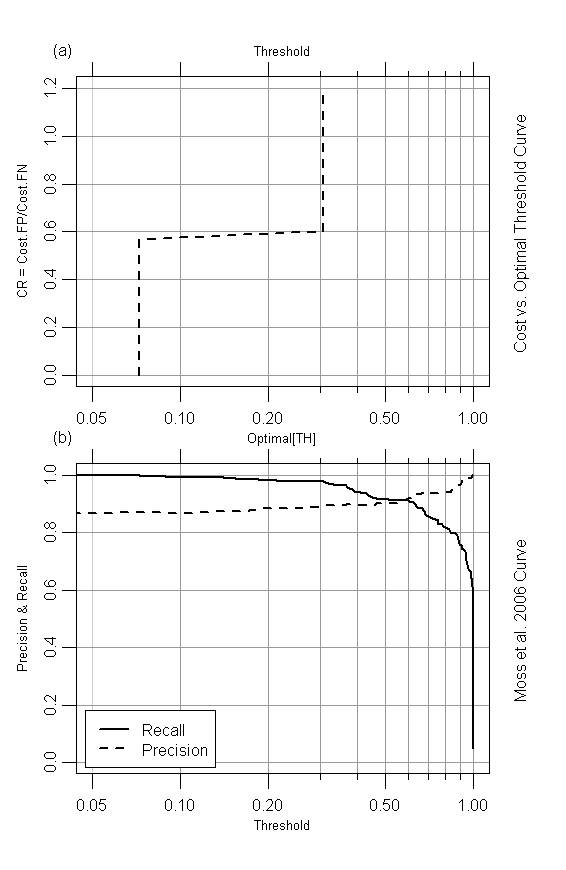 P-R cost curve to determine the optimal threshold of liquefaction (THL) triggering for probabilistic evaluation (a) precision and recall vs. threshold (b) cost ratio vs. optimal THL. |
Liquefaction Induced Lateral Spreading
The geotechnical earthquake engineering community often adopts empirically derived models. Unfortunately, the community has not embraced the value of model validation leaving practitioners with little information on the uncertainties present in a given model and the model's predictive capability. In this study, we present a machine learning technique known as Support Vector Regression (SVR) together with rigorous validation for modeling lateral spread displacements and outline how this informationcan be used for identifying gaps in the dataset. We demonstrate the approach using the free face lateral displacement data compiled by Youd et al. (2002). The results illustrate that the SVR has relatively better predictive capability than the commonly used empirical relationship derived using multi-linear regression. Moreover, the analysis of the SVR model and its support vectors help in identifying gaps in the data and to define the scope for future data collection.
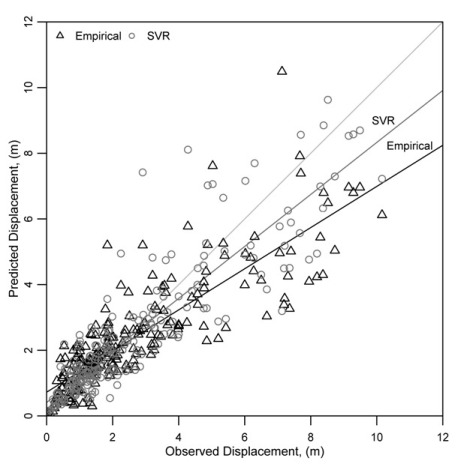 Observed versus predicted lateral spread displacement using empirical and SVR approaches for free face cases; the lighter line is the line of equality, and the darker lines are the linear models of the observed and predicted values for the empirical and SVR models; the linear models are included to summarize the general trends in the predictions of the different models |
