Abstract
A New Long-Term Record of Volcanic SO2 Generated From HIRS/2
Satellite Data
Volcanic eruptions that inject ash, sulfur dioxide and other gases into the atmosphere occur on average more than 50 times per year somewhere on Earth. Volcanic eruptions produce a variety of hazards, ranging from short term aircraft hazards, to longer term effects from climate perturbation. However, many important details regarding the magnitude and frequency of sulfur emissions, and chemical and physical processes within volcanic clouds remain unclear. Some key questions may be largely solved if more data were available: issues of excess sulfur from volcanic outgassing; the separation of ash-rich and gas-rich portions of the clouds; the conversion of H2S to SO2 in the atmosphere; and the removal rates of SO2 in the atmosphere.
The most practical means of monitoring large volcanic emissions of sulfur is through satellite remote sensing, and since 1979 the majority of SO2 measurements have been through NASA's Total Ozone Mapping Spectrometer (TOMS). These measurements rely on reflected ultraviolet radiation and consequently have poor diurnal sampling and low spatial resolution. Two new methods have been proposed which employ infrared channels of the Moderate Resolution Infrared Spectroradiometer (MODIS) sensor, each of which have the ability to quantitatively retrieve SO2 masses. Our previous analyses of MODIS 7.3 mm data for eruptions at Hekla (2000) and Cleveland (2001) volcanoes have demonstrated that it is possible to estimate upper tropospheric SO2 layer abundance using the anti-symmetric stretch of the SO2 molecule.
This proposal focuses on the High Resolution Infrared Radiation Sounder/2 (HIRS/2) sensor, which also includes a 7.3 mm channel, on board the NOAA polar orbiting satellites since 1978. We propose to analyze HIRS radiances within this channel to map and quantify volcanic SO2 emissions, and construct a long term dataset complementary to TOMS but with potentially improved spatial and temporal resolutions. This additional coverage will greatly enhance our ability to study the dozens of observable eruptions in the past 20 years, as well as provide an important link to data from new sensors. Specifically, we propose to:
(1)
acquire and process datasets for volcanic eruptions from HIRS/2, to
match with the TOMS and MODIS data we have already archived;
(2)
develop and refine our techniques for sulfur dioxide retrievals with the
7.3 mm
channel using several key eruptions, under varying environmental and plume
conditions; and
(3) create a long-term volcanic SO2 database from HIRS/2, with MODIS overlap and TOMS data to compare and cross-validate the results.
This proposal responds to the NASA NRA in the following ways: to the Earth Science Enterprise goal of studying the changing Earth, it supports the creation of an independent long term database of global volcanic emissions; by developing this new volcanic record it complements and enhances the usefulness of the existing (TOMS) database funded by the SENH program; by generating more detailed erupted sulfur budgets it will foster many science applications for understanding magmatic processes and cloud fates; and the HIRS/2 methodology provides an additional means of monitoring and understanding global volcanic activity, and consequently, volcanic hazards.
Technical Plan
A New Long-Term Record of Volcanic SO2 Generated From HIRS/2
Satellite Data
Background and Relevance
The impacts and hazards from volcanic eruptions are potentially large, because their characteristically infrequent bursts of activity have the potential to inject ash, sulfur dioxide and other gases into the upper troposphere and stratosphere. Following large events, the SO2 gas emplaced in the stratosphere the converts to a sulfate aerosol which in turn affects the radiation budget of the planet by scattering shortwave radiation and absorbing longwave radiation. This generally leads to surface cooling (e.g., Rampino and Self, 1984; Mass and Portman, 1989). Upper tropospheric sulfur dioxide and sulfate are hazards to jet aircraft due to their corrosive nature, and because they are often accompanied by volcanic ash which damages jet turbine engines (Casadevall, 1994). Estimation of SO2 emissions from volcanoes is also important for diagnosing processes within active volcanic systems, as the amounts and rates of emissions provide clues as to magma movement, degassing properties, and thus potential eruption characteristics (e.g., Symonds et al., 1994; Wallace and Gerlach, 1994).
Since volcanic eruptions are sporadic events and there might be few eruptions in some periods of time, a long observation period is required to provide enough data to assess many volcano-atmosphere issues. There are two substantial eruptions, Pinatubo and El Chichón, and many other smaller eruptions in the past 20 years. Some important questions are still unresolved but may potentially be solved if more data were available. One central focus is the issue of excess sulfur (e.g., Andres et al., 1991; Scaillet et al., 1998). Another problem is the separation of ash-rich and SO2-rich portions in volcanic clouds (Bluth et al., 1994; Schneider et al., 2000). A further question is the possibility of H2S-SO2 conversion in the atmosphere (Bluth et al., 1995; Rose et al., 2000). The removal rate of sulfur dioxide in the atmosphere is also key to understanding effects of volcanogenic emissions (Oppenheimer et al., 1998; Barker et al., 1998).
Measuring and retrieving the burden of SO2 in volcanic clouds is an important part of studying volcano-atmosphere interactions. Retrieval of volcanic SO2 using remote sensing technology has been investigated during last decade, most commonly by the Total Ozone Mapping Spectrometer (TOMS) (Bluth et al., 1993; Krueger et al., 2001). However, TOMS uses reflected ultraviolet radiation and consequently is limited by poor diurnal sampling and low spatial resolution. Limited studies at thermal infrared wavelengths include the Thermal Infrared Multispectral Scanner (TIMS) and the NCAR Fourier Transform Spectrometer (Realmuto et al., 1994; Crisp, 1995; Realmuto et al., 1997; Realmuto and Worden, 2000). Microwave measurement of SO2 using the Microwave Limb Sounder (MLS) instrument aboard Upper Atmosphere Research Satellite (UARS) has also been used for the 1991 Pinatubo eruption (Read et al., 1992; Crisp, 1995).
Analyses of the Moderate Resolution Imaging Spectroradiometer (MODIS) data have resulted in two new methods for sulfur dioxide retrievals. An absorption feature at 8.2 - 9.2 µm can be exploited by the method of Realmuto et al. (1997), which derives SO2 through comparison with background radiances. Prata et al. (2002) have demonstrated a second, completely independent method using 7.3 µm data for Hekla and Cleveland volcanic eruptions. This work indicates that it is possible to estimate upper-tropospheric SO2 layer abundance using the strong absorption band centered about 7.2 µm. Despite the existence of strong water vapor features in this channel, sulfur dioxide abundance above ~5km can be estimated owing to the relatively low water contents in the atmosphere above 5 km.
The TIROS
Operational Vertical Sounder (TOVS) suite of instruments have a 7.3 mm channel within the High Resolution Infrared
Radiation Sounder/2 (HIRS/2) which senses radiation from SO2 and has
produced such data since 1978. The
HIRS/2 provides the basic 20 channel IR temperature and humidity soundings of
the TOVS system. All HIRS/2 channels are
used to provide information on temperature and humidity profiles, surface temperature,
cloud parameters and total ozone (http://www.eumetsat.de/en/index.html). The average orbital height of HIRS/2 is 830
km and the spatial resolution is about 17.5 km at nadir and 58.5 x 30 km2 for the first
and last pixels of a scan line, with each scan taking 6.4 seconds. Full daily coverage is achieved through 14
orbits per day, each with an approximately 2240 km swath width.
Table 1. Key
Characteristics of HIRS/2, MODIS and TOMS sensors.
|
HIRS/2 a |
MODIS a |
TOMS b |
||||||
|
Spatial
Resolution: 17.5 km (nadir) |
Spatial Resolution = 1
km |
Spatial
Resolution: 39 km (nadir) |
||||||
|
Channel |
mm |
Uses |
Channel |
mm |
Uses |
Channel |
nm |
Uses |
|
12 |
6.72 |
H2O |
27 |
6.72 |
H2O |
1 |
308.6 |
SO2, O3 |
|
11 |
7.33 |
H2O, SO2 |
28 |
7.33 |
H2O, SO2 |
2 |
313.5 |
SO2, O3 |
|
10 |
8.16 |
H2O |
29 |
8.55 |
SO2, sulfate, ash |
3 |
317.5 |
SO2, O3 |
|
9 |
9.71 |
O3 |
30 |
9.73 |
O3, sulfate |
4 |
322.3 |
SO2, O3 |
|
8 |
11.11 |
Ash, ice, sulfate |
31 |
11.03 |
Ash, ice, sulfate |
5 |
331.2 |
SO2, O3
ash, aerosol |
|
7 |
13.35 |
ash |
32 |
12.02 |
ice, sulfate, ash |
6 |
360.48 |
ash, aerosol |
aYu and Rose, 2000
bKrueger
et al., 2000; ozone and SO2 retrievals are derived from varying band
combinations.
Sulfur dioxide absorption
was noted in HIRS/2 spectra of the El Chichon
eruption by Susskind (1982). Consequently, an SO2 detection
alert algorithm using MODIS and HIRS/2 data was developed by Crisp (1995), but
methods for retrieving and retrospective the SO2 amount
using global HIRS/2 data sets were not investigated. Our work strongly suggests it is possible to
analyze HIRS/2 data, using the 7.3 µm channel, to derive the sulfur dioxide
concentrations associated with explosive volcanic eruptions (Prata et al., 2002).
In this study, we plan to analyze the HIRS/2 radiance data and develop
methodologies for SO2 measurement using the past
20 years of HIRS data. The water vapor
channels (10 to 12), split window channel (8) and ozone channel (9) will all be
required in data processing and analysis.
Exploratory work on selected eruptions will allow us to properly
calibrate the retrieval tools required to derive SO2 from
HIRS/2 channel 11 and show how sensitive this method might be (Prata et al., 2002).
Preliminary case studies
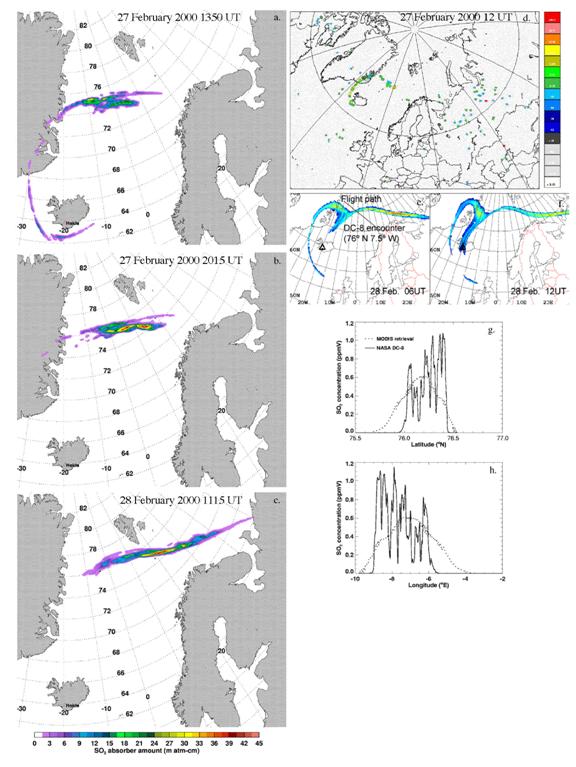
Initial, 7.34 mm-based, retrievals of upper tropospheric SO2 have been done using MODIS data, acquired between 27 and 28 February 2000 over the region 50°N to 80°N and 40°W to 30°E, during the recent Hekla eruption of 26 February, 2000. The results suggest that the infrared absorption in the 7.34 mm MODIS channel (Table 1) can be used to estimate the concentration of sulfur dioxide in the upper troposphere. However, some of this absorption is also due to water vapor.
A scheme for estimating, on a pixel-by-pixel basis, the contribution to the absorption by the background atmosphere was derived (Prata et al., 2002). This is achieved by using MODIS infrared channels with band centers that lie below (channel 27-6.78 m_m) and above (channel 32- 12.02 m_m) the 7.34 m_m channel. For an SO2-free atmosphere, the radiance in these three channels varies with wavelength in an almost linear manner. Thus for each MODIS image the radiance at 7.34 mm can be estimated by linearly interpolating the radiances at 6.78 m_m and 12.1 m_m. When there is excess absorption in the 7.34 m_m channel, the difference between the estimated and the actual 7.34 mm radiance is due to the presence of SO2. The reason why the 8.55 mm channel (MODIS channel 29) was not used in the retrieval is that this channel is affected by both SO2 absorption and some absorption effects due to silicates in volcanic ash. The 6.78 m_m (channel 27) and 12.02 m_m channels (channel 32) are entirely free of SO2 absorption and to a lesser degree volcanic ash effects, and may require little or no correction. The scheme is applied to MODIS data on a pixel-by-pixel basis (1354 pixels by 2030 lines) and maps of SO2 are derived at 1 x 1 km2 spatial resolution, by weighting retrievals for off-nadir pixels by their respective field-of-view areas.
The SO2
retrievals for Hekla eruption using three
different sensors (MODIS, HIRS/2, and TOMS) are shown in Figure 1 (Prata et al., 2002).
The SO2 plume apparently
went to the northeast initially before being transported in a spiral southwards
and westwards. In the early hours of 29
February a NASA DC-8 encountered the plume while on an atmospheric chemistry
mission (the SOLVE experiment).
Measurements of SO2 were
made as the DC-8 traversed the plume.
This accidental encounter has allowed us to validate the satellite
retrievals for the MODIS image of 29
February at 1115 UT.
The DC-8 encountered the plume at
approximately 0511 UT, some 6 hours before the first good MODIS image. By using wind vectors at 200 hPa obtained from the CANERM (Canadian Emergency Response
Model) plume dispersion model operated by the Meteorological Service of Canada
we have advected the MODIS plume backwards in time
and compared the MODIS retrieval with the DC-8 measurements (Figure 1, panels
e-h). The in situ measurements
indicated great variability (a function of the spatial resolution) and peak
amounts of 1 ppmV, whereas the MODIS retrieval has
much less variability and smaller peak values.
The latitudinal spread of the plume is slightly greater in the MODIS
retrieval. The DC-8 was at an altitude
of 10.4 km when it encountered the plume, and essentially sampled the plume at
that height through a single traverse of the plume. Despite these sampling differences, the
integrated SO2 amounts
from the DC-8 (248 ppmV) and from the MODIS retrieval
(241 ppmV) are in good agreement. The shapes and
locations of the sulfur dioxide cloud at the same approximate times in MODIS,
TOMS, and HIRS/2 images are also very similar.
Retrievals were subsequently performed for
two other eruptions, using HIRS/2 data:
the June, 1991 eruption of Mt. Pinatubo, and the August, 1991 eruption
of Cerro Hudson, Chile. Eruption clouds
from both eruptions were readily observed (Figure 2).
Figure
1. (a)-(c). SO2 retrievals
from the 7.34 _m MODIS
channel on 27 and 28 February, 2000. (d)
TOMS SO2 retrieval for February 27 at 12 UT. (e)-(f) Plume dispersion results for
the Hekla eruption at 06 UT and 12 UT on 28 February
at the 200 hPa level. (g)-(h) SO2 concentration
comparison between NASA DC-8 aircraft (measured) and MODIS retrievals.

Figure 1. (i) HIRS/2 SO2 retrieval
for February 27. The missing data scans are the result of calibration sequences.
(a) (b)
Figure 2. Preliminary study of retrieving SO2
concentrations using HIRS/2 data for (a)
August, 1991 Cerro Hudson Eruption
and (b) June, 1991 Pinatubo Eruption.
The pertinent conclusions from our preliminary study are: (a) the HIRS/2 retrieval methodology and database are, by early indications, excellent for retrospective studies; and (b) the HIRS data and imagery are consistent and highly complementary to those from contemporary satellite sensors like TOMS, and from modern instruments like MODIS.
Synthesized Volcanic Cloud
Studies at Michigan Tech
In the past few years, our research group has made significant progress in studies of volcano-atmosphere interactions, through a combination of remote sensing, laboratory, and theoretical modeling studies. Much of the research and collaborative work have been the result of NASA SENH funding. Complete conversion of SO2 to sulfate in the stratosphere occurs at an e-folding rate of about 120 days. While the SO2 loss from stratospheric volcanic clouds has an apparent e-folding rate of about 35 days, the SO2 loss rate for volcanic clouds remain in the troposphere or lower stratosphere appears to be much more rapid, on the order of a few days (Bluth et al., 1992; 1997; Barker et al., 1998; Oppenheimer et al., 1998). The latter limits the stratospheric aerosol buildup from smaller eruptions (Bluth et al., 1997) and removal processes are most effective in wet eruptions where ice nucleates and grows on ash particles (Rose et al., 1995).
We can now map and measure both ash and SO2 using both infrared (Wen and Rose, 1994; Realmuto et al., 1997) and ultraviolet data (Krueger et al., 2001; Krotkov et al., 1997). The infrared retrieval scheme now includes atmospheric corrections (Yu, 2000) and this enables us to look at smaller volcanic clouds (Rose and Mayberry, 2000). We have developed a multispectral IR technique (for the MODIS sensor) which retrieves information on sulfate aerosols as well as ash (Yu and Rose, 2000). Our initial work with modeling volcanic clouds (Guo et al., 2000) has helped us evaluate theories of volcanic cloud evolution. Laboratory measurements relating ash particle geometry to fallout characteristics (C. Riley, Ph.D. thesis in progress) have helped us evaluate the effects on radiative transfer models (Krotkov et al., 1999). Laboratory work on adsorption on fine volcanic ash (Gu, 2001) has helped quantify rates of uptake and release of sulfur dioxide gas under a range of atmospheric conditions. Currently, we are attempting to take advantage of our previous techniques of retrieving both ash and gas species, to study the dozen or so documented cases of species separation in drifting clouds (Schneider et al., 2000).
An international workshop, Remote Sensing of Volcanic Clouds, was held July 29-August 3, 2001, at Michigan Technological University (Rose, 2001). The workshop's goal was to improve and expand the use of satellite-based remote sensing data for hazard mitigation and other research purposes, such as volcano-atmosphere interactions and chemical and meteorological effects on the troposphere and stratosphere. Forty-six researchers attended, representing 11 countries, 9 universities, and several government meteorological and volcanological organizations, as well as the Volcanic Ash Advisory Centers in Washington, D.C., Anchorage, Montreal, Darwin, London, and Toulouse.
The
workshop consisted of presentations about volcanic clouds and extended computer
laboratory sessions in which attendees worked with actual satellite remote
sensing data. The participants covered
the current and future status of remote sensing instruments and their detection
capabilities by reviewing examples of eruptions; and discussing and
demonstrating new techniques for improving detections, such as atmospheric
corrections, accurate assessment of
initial eruption conditions, environmental conditions during eruptions,
and variable volcanic phenomena.
Satellite coverage and limitations and integrating trajectory models
into mitigation efforts were also discussed, as was how volcanic cloud hazards
mitigation efforts could be improved through validation, modeling, multi-sensor
comparisons, and different band selections.
Common issues discussed were the need for timely, accurate, and
diagnostic predictions by agencies involved in monitoring and ash cloud
detection and the need for timely dissemination of educational information to
responsible agencies and the public.
Sponsorship by NASA's Solid Earth Natural Hazards Program helped fund
the meeting and the attendance of many graduate students.
Project Objectives
This project focuses on three main objectives:
(1)
Data acquisition: We will construct a set of HIRS data to
coincide with known volcanic eruption observations by both TOMS and MODIS sensors.
Complementary HIRS/2, TOMS and MODIS data sets need to be acquired first. The MODIS and TOMS data sets (Hekla and Cleveland eruptions) are largely already in our database, but will updated as new eruptions occur. We need to get complete HIRS/2 datasets for several important eruptions in the past 20 years (e.g., Pinatubo, El Chichon, Cerro Hudson, Mt. St. Helens). A computer facility with large disk space has been built up in our research group, and will be used for storage and processing the past 20 years of HIRS data for this study.
(2)
Methodology. A robust methodology will be developed to map
and retrieve SO2 masses from a variety of different
environmental conditions.
The techniques will be developed and checked based on the analysis of those important eruptions. The preliminary study of Hekla eruption using MODIS and HIRS/2 data indicates that it is possible to use IR sensing to retrieval the volcanic SO2 concentration. The more detailed methods and techniques will be developed based on the study of different eruptions (key events of the past 20 years) as well as different environmental conditions.
(3)
Applications. We will generate a long term, volcanic SO2 database
from the HIRS/2 sensor, to complement existing and future data from TOMS and
MODIS; this information will form the basis of many applications of plume
chemistry and fates.
Sensitivity studies will be performed by comparing the results from different sensors and different real conditions. MODIS overlap and TOMS database will be used to compare and correct the results. The techniques will be modified, a more validated, advanced, and completed method will be developed. A database of HIRS retrievals will be produced, for comparison to the TOMS and MODIS datasets. The development of a complementary SO2 database will provide important additional data for volcanic cloud studies: particularly, reaction-based studies which require more frequent mass retrievals (such as separation, conversion and removal processes) will benefit from more frequent data availability.
Technical Approach
There are a
total of 36 bands measured by the MODIS instrument. The bands used to detect the volcanic cloud
(volcanic ash and gases) are band 27 to band 32 (Table 1). The 7.34 mm
channel (band 28) of the MODIS instrument is currently used to measure the
upper tropospheric water vapor. This channel also adsorbs radiation from
other gases, especially for SO2. Figure 3 shows the line strengths of SO2
taken from the HITRAN96 database (Rothman et al., 1987) and indicates
that the SO2 absorptions are in the n1-band, between 8.2 and 9.2 mm, and the n3-band,
between 7.2 and 7.5 mm (MODIS bands 27,
28 and 29). Figure 3b gives atmospheric
transmittance in a vertical path to space due to all atmospheric gases and
especially for water vapor - the main absorber/emitter in this region of the
infrared spectrum. Figure 3c shows the
brightness temperatures at the top-of-the-atmosphere, deduced using a monochromatic
radiative transfer program, for an atmosphere with
background SO2 concentrations (black line) and the SO2
concentration of 35 m atm-cm (red line) where 1 m atm-cm = 2.678 x 10 molecules cm-2. The difference between these two calculations
is shown in Figure 3d. Figure 3d
illustrates that the SO2 absorption for n3-band
is significantly stronger than the n1-band,
but there is also greater water vapor absorption across the n3-band, as shown in Figure 3b. Previous studies (Realmuto
et al., 1997; Realmuto and Worden, 2000) used the n1-band (centered at _ 8.6 mm)
to retrieve the SO2 concentration (because of the lack of
interference from water vapor for this band), or used very high resolution
spectroscopic measurements (Mankin et al., 1992;
Goldman et al., 1992) to exploit the 'micro' windows between 1300 and 1400 cm-1 (7.14 - 7.69 mm).
It is generally believed that water vapor absorption makes it difficult
to determine SO2 from broad band measurements in the n3-band.
This is true for SO2 in the lower troposphere where most of the
atmospheric water vapor resides. But for
higher altitude (above 6 km or so), based on global climatological
considerations, there is less than 5% of the total precipitable
water above that layer. Therefore,
broadband measurements (n3-band) of the
excess absorption of 7.34 mm infrared
radiation in the upper troposphere and lower stratosphere can be used to infer SO2
concentrations (essentially, at 7.34 mm,
the sensor cannot detect the ground; it uses emissions from water vapor below
the plume as a source of electromagnetic radiation).
The
following equations are the transmission function model (Prata
et al., 2002), t of the n3 SO2 band as a double-exponential function of SO2
absorber amount, Uabs.

The scaled
absorber amount is Wabs, T is atmospheric temperature,
p is atmospheric pressure, T0 and P0 are values at
Standard Temperature and Pressure (STP) conditions. The coefficients Ci,
a, n and m are wavelength dependent and have been determined through
comparisons with detailed line-by-line radiative transfer
calculations (McKeen et al., 1984). Figure 4a gives the relationship between
absorber amount and transmission, the transmission as a function of absorber
amount for a modeled SO2 plume located at 10 km with a vertical spread
of 2 km. Figure 4 also indicates that
the relationship between transmission and absorber amount is approximately
linear over the range of absorber amounts 0-100 m atm
cm. The contribution to the radiation
reaching a radiometer viewing the atmosphere from above over a narrow band
of
Figure 3. Panel a.
Line strengths for SO2. Also shown are the nominal filter
response functions for MODIS bands 27, 28 and 29. Panel b. Atmospheric transmission as a function of wave number (cm__) through a vertical
path of an atmosphere containing gases and no cloud. Panel c. Top of the atmosphere brightness temperatures as a
function of wave number for a standard atmosphere with background
concentrations of SO2 and, for the same atmosphere but with
significantly elevated levels of SO2 (red line). Panel d. Brightness temperature
differences between the background and elevated SO2 atmospheres.
Figure 4
Figure 4. (a) Transmission
as a function of absorber amount for the SO2-band. (b) Weighting functions for SO2
and water vapor.
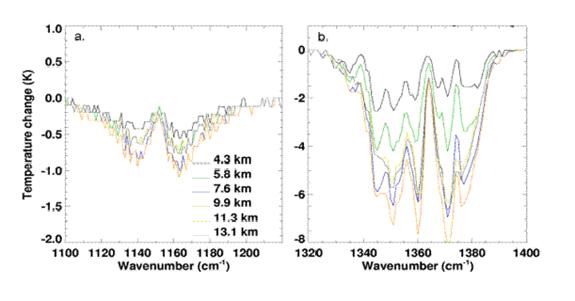
Figure 5. Medium resolution (2 cm__) radiative transfer calculations of the brightness
temperature deficit-defined as difference between the background atmosphere and
an atmosphere containing 0.08 ppmV of SO2 -as a function of
wave number for (a) the SO2 __-band, and (b) the SO2 __-band. Each line shows the deficit
obtained for a plume 1 km thick centered at the indicated height above the surface.
wave numbers (the radiometer channel), from different portions of the
atmosphere is described mathematically by a weighting function. Denoting the Planck function by B[T(p), n], where T(p)is the vertical temperature
profile in the atmosphere, and ps is the
surface pressure, the weighting function, W, can be calculated from

The weighting functions for the SO2 n3-band
(MODIS channel 28) and for the lower troposphere water vapor channel (MODIS
channel 27) are shown in Figure 4b. The
peak of the weighting function for channel 28 occurs around 350 hPa, and indicates that this channel is sensitive to upper tropospheric sulfur
dioxide.
Radiative transfer calculations using a 2 cm-1 spectral resolution model (MODTRAN-3b) for a sulfur dioxide concentration of 0.8 ppmV at various heights in the atmosphere are shown in Figure 5 for the SO2 n1-band (left panel) and for the SO2 n3- band (right panel). These calculations show the temperature differences (background SO2 - anomaly) expected across each of the bands. The biggest differences occur when the plume is situated around 9.9 km; smaller differences occur when the plume is either higher or lower. These results are only slightly sensitive to the plume vertical extent.
Expected Significance
There are a number of important results and applications of this work that are specific to the NASA NRA, and that will benefit the scientific community in general.
(1) Generation of a robust database of volcanic sulfur dioxide emissions. The HIRS dataset extends back to 1978, and thus provides complementary coverage to the TOMS sensors. Current eruptions can also be studied by the TOMS (which unfortunately is suffering from some degradation), MODIS, and HIRS/2. There are now two separate techniques for deriving SO2 masses from MODIS, which extends it's capabilities. The TOMS (1 per day) and MODIS (1 per two days) temporal resolutions will be enhanced by the HIRS/2 daily coverage provided by multiple NOAA platforms. We expect that there will be cases where short-lived eruptions which are not observed by TOMS or MODIS will be detected by the HIRS/2. Thus, the long-term global coverage of explosive volcanism by satellite sensors will be vastly improved.
(2) An additional, spectrally unique methodology for analysis of volcanic clouds. The TOMS sensor has been the mainstay of remote sensing for volcanic SO2 emissions since 1979. While observing over a hundred individual eruption clouds, TOMS detection and retrievals are hindered by its low temporal (once per day) and spatial (39 km at nadir) resolutions, and daytime-only viewing. The addition of MODIS to observe and quantify clouds using infrared wavelengths has provided an important means for cross-validation and improved spatial resolution, but with lower sampling frequency (every two days). The HIRS/2 approach is therefore extremely valuable because of the ability for retrospective studies with TOMS, and that it provides another independent means of detecting and studying volcanic SO2 clouds. The development of the HIRS/2 SO2 retrieval methodology provides important improvements in spatial and temporal resolution, and thus far has shown to be consistent with both TOMS and MODIS retrievals for near-simultaneous datasets.
(3) Science applications. We have noted four key question regarding explosive volcanic emissions that have the potential of being solved given sufficient data: causes and characteristics of excess sulfur emissions; determination of potential H2S emission and conversion to SO2 in erupted clouds; the separation of ash and gas-rich phases in erupting as well as drifting clouds; and removal rates of sulfur dioxide in the troposphere and stratosphere. The potential for significant progress towards these issues is great. Thus far we have typically lacked sufficient data to make much headway towards understanding reaction-based processes in volcanic clouds. With the HIRS/2 data we have the potential to more than double our current archives of cloud images and data, based on our initial results.
(4) Outreach. NASA Earth Science Enterprise has stated goals of broadening its applications and influence throughout the global scientific community. This project is therefore very timely, following the recent international workshop on Remote Sensing of Volcanic Clouds hosted by Michigan Tech. Although much of the workshop focused on ash retrievals and tracking, some of the key recommendations from that conference (Rose, 2001) are pertinent to this study:
-making recommendations for instrumental improvements for volcanic cloud remote sensing applications particularly for improvements of the Geostationary Operational Environmental Satellite (GOES) instruments after GOES-Q (~2009).
-providing constructive input to NOAA's forum for information about Natural Hazards Information Strategy.
-encouraging Moderate Resolution Imaging Spectroradiometer (MODIS) use for volcanic clouds.
-developing a strategy to provide better source term information for volcanic cloud trajectory models.
-building constructive partnership/linkages and input from the informal group of workshop attendees to other professional organizations worldwide (IAVCEI, AGU, CEOS, WMO, ICAO, AMS, etc.).
A second international workshop on the remote sensing of volcanic clouds is being planned for summer 2003, at Michigan Technological University. In this next workshop, we will try to improve on our initial efforts by encouraging representation from all of the Volcanic Ash Advisory Centers. We hope to have greater representation from volcano observatories and at least some representation from the aircraft industry and dispatchers. We also will encourage and recruit graduate students to attend and plan to increase the size of the workshop to 50-75 participants.
References
Andres, R.J., W.I. Rose, P.R. Kyle, S. de Silva, P.W. Francis, M.C. Gardeweg, and H. Moreno, 1991, Excessive sulfur dioxide emissions from Chilean volcanoes. J. Volc. Geotherm. Res., 46, 323-329.
Barker, S.L., G.J.S. Bluth, and A.J. Krueger, 1998, Examining the removal rate of volcanogenic SO2 in the atmosphere. Eos Trans. AGU, 79, F935.
Bluth, G.J.S., S.D. Doiron, A.J.
Krueger, L.S. Walter, and C.C. Schnetzler (1992)
Global tracking of the SO2 clouds from the June, 1991 Mount Pinatubo
eruptions. Geophys.
Res. Lett., 19, 151-154.
Bluth, G.J.S., C.C. Schnetzler,
A.J. Krueger, and L.S. Walter, 1993, The contribution of explosive volcanism to
global atmospheric sulphur dioxide concentrations.
Nature, 366, 327-329.
Bluth, G.J.S., T.J. Casadevall,
C.C. Schnetzler, S.D. Doiron,
L.S. Walter, A.J. Krueger, and M. Badruddin (1994)
Evaluation of sulfur dioxide emissions from explosive volcanism: the 1982-1983 eruptions of Galunggung, Java, Indonesia. J. Volc. Geotherm. Res., 63, 243-256.
Bluth, G.J.S., C.J. Scott, I.E. Sprod,
C.C. Schnetzler, A.J. Krueger, and L.S. Walter
(1995) Explosive SO2 emissions from the
1992 eruptions of Mount Spurr, Alaska. U.S. Geological Survey Bulletin 2139, 37-45.
Bluth, G. J. S., W.I. Rose, I.E. Sprod,
and A.J. Krueger, 1997, Stratospheric loading from explosive volcanic
eruptions, J. Geology, 105, 671-683.
Casadevall, T.J., 1994, The 1989-1990 eruptions of Redoubt
volcano, Alaska: Impacts on aircraft
operations. J. Volc.
Geotherm. Res., 62, 301-316.
Crisp, J.,
1995, Volcanic SO2 Alert, NASA EOS IDS Volcanology
Team Data Product document, Product # 3288 (http://eos.pgd.hawaii.edu/docs/dpd.html).
Goldman,
A., F.J. Murcray, C.P. Rinsland,
R.D. Blatherwick, S.J. David, F.H. Murcray, and D.G. Murcray, 1992.
Mt. Pinatubo SO2 column measurements from Mauna Loa, Geophys. Res. Lett., 19, 183-186.
Gu, Y., 2001, Laboratory
study of SO2 adsorption
onto fine volcanic ash. M.S. Thesis, Michigan Technological University.
Guo, S., W.I. Rose, G.J.S. Bluth,
C. Textor, and H.-F. Graf (2000) ATHAM model simulation of the 15 June 1991
Pinatubo volcanic plume. Eos Trans. AGU,
81, F1287.
Krueger,
A.J., S. Schaefer, N. Krotkov, G. Bluth,
and S. Barker (2000) Ultraviolet remote
sensing of volcanic emissions and applications to aviation hazard
mitigation. Geophysical Monograph Series
116, 25-43.
Krotkov, N.A., A.J. Krueger and P.K. Bhartia,
1997, Ultraviolet model of volcanic clouds for remote sensing of ash and sulfur
dioxide. J. Geophys. Res., 102, 21,891-21,904.
Krotkov, N.A., D.E. Flittner,
A.J. Krueger, A. Kostinski, C. Riley, W. Rose, and O.
Torres, 1999, Effect of particle non-sphericity on
satellite monitoring of drifting volcanic ash clouds. J. Quant. Spect. Rad. Trans., 63, 613-630.
Mankin, W. G., M.T. Coffey, and A. Goldman, 1992, Airborne
observations of SO2, HCl,
and O3 in the stratospheric plume of the Pinatubo volcano in July
1991, Geophys. Res. Lett.,
19, 179-182.
Mass, C.F.,
and D.A. Portman, 1989, Major volcanic eruptions and climate: A critical evaluation. J. Climate, 2, 566-593.
McKeen, S.A., S.C. Liu, and C.S. Kiang, 1984, On the
chemistry of stratospheric SO2 from volcanic eruptions: J. Geophys. Res., 89 (D3), 4873-4881.
Oppenheimer,
C., P. Francis, and J. Stix, 1998, Depletion rates of
sulfur dioxide in tropospheric volcanic plumes. Geophys. Res. Lett., 25, 26671-2674.
Prata, A.J., M. Watson, W.I. Rose, V. Realmuto, G.J.S. Bluth,
R. Servranckx, 2002, Volcanic sulfur dioxide concentrations derived from infrared satellite
measurements, in prep.
Rampino, M.R., and S. Self, 1984, Sulfur-rich volcanic
eruptions and stratospheric aerosols.
Nature, 310, 677-679.
Read, W.G., Froidevaux, L.,
and J.W. Waters, 1993, Microwave Limb Sounder measurement of stratospheric SO2
from the Mt. Pinatubo volcano. Geophys. Res. Lett., 20,
1299-1302.
Realmuto, V.J., M.J.
Abrams, M.F. Buongiorno, and D.C. Pieri,
1994, The use of multispectral thermal infrared image
data to estimate the sulfur dioxide flux from volcanoes: A case study from
Mount Etna, Sicily, July 29, 1986, J. Geophys. Res., 99, 481-488.
Realmuto, V.J., A.J.
Sutton and T. Elias, 1997, Multispectral thermal infrared
mapping of sulfur dioxide plumes: A case
study from the East Rift Zone of Kilauea Volcano, Hawaii. J. Geophys. Res., 102,
15,057-15,072.
Realmuto, V.J., and H.M. Worden, 2000, Impact of
atmospheric water vapor on the thermal infrared remote sensing of volcanic
sulfur dioxide emissions: A case study from the Pu'u
'O'o vent of Kilauea Volcano, Hawaii, J. Geophys. Res., 105(B9),
21,497-21,508.
Rothman,
L.S., R.R. Gamache, A. Goldman, L.R. Brown, R.A. Toth, H.M. Pickett, R.L. Poynter,
J-M. Flaud, C. Camy-Peyret,
A. Barbe, N. Husson, C.P. Rinsland, and M.A.H. Smith, 1987, The HITRAN database: 1986
Edition, Appl. Opt., 26, 4058-4097.
Rose, W.I.,
D.J. Delene, D.J. Schneider, G.J.S. Bluth, A. J. Krueger, I. Sprod,
C. McKee, H.L. Davies, and G.G.J. Ernst, 1995, Ice in the 1994 Rabaul eruption cloud: implications for volcano hazard and
atmospheric effects. Nature, 375,
477-479.
Rose, W.I.
and G.C. Mayberry, 2000, Use of GOES thermal infrared imagery for eruption
scale measurements, Soufrière Hills, Montserrat, Geophys. Res. Lett., 27,
3097-3100.
Rose, W.I.,
G.J.S. Bluth and G.G.J. Ernst (2000) Integrating retrievals of volcanic cloud characteristics
from satellite remote sensors - a summary.
Phil. Trans. Royal Soc. London, Series A, v. 358, 1585-1606.
Rose, W.I.,
2001, Remote sensing of volcanic clouds shows promise, EOS Trans. AGU, 82, 471.
Scaillet, B., B. Clemente, B.W.
Evans, and M. Pichavant, 1998, Redox
control of sulfur degassing in silicic magmas. J. Geophys. Res.,
103, 23,937-23,949.
Schneider,
D.J., W.I. Rose, and G.J.S. Bluth, 2000, Satellite
observations of the separation of volcanic ash and sulfur dioxide in the
atmosphere. Eos Trans. AGU, 81, F1276.
Susskind J., 1982, HIRS/MSU Sounders in Radiative
Effects of the El Chichón volcanic eruption:
preliminary results concerning remote sensing (Bandeen
W.R. and Fraser R.S., eds.) NASA Technical Memorandum 84959, 4-12 to 4-24.
Symonds, R.B., W.I. Rose, G.J.S. Bluth,
and T.M. Gerlach (1994) Volcanic-gas studies: Methods, results, and applications. In, Volatiles in Magmas (M.R. Carroll and
J.R. Holloway, eds.), Rev. Mineral., 30, 1-60.
Wallace,
P., and T.M. Gerlach, 1994, Magmatic
vapor source for sulfur dioxide released during volcanic eruptions: Evidence from Mount Pinatubo. Science, 265, 497-499.
Wen, S., and W.I. Rose, 1994, Retrieval of Particle sizes
and masses in volcanic clouds using AVHRR bands 4 and 5, J. Geophys.
Res., 99, 5421-5431.
Yu, T.,
2000, Improved algorithms for volcanic clouds using multispectral
infrared remote sensing. Ph.D. Thesis, Michigan Technological University.
Yu, T., and Rose W.I., 2000, Retrieval of sulfate and silicate ash masses in young (1 to 4 days old) eruption clouds using multiband infrared HIRS/2 data. AGU Monograph 116, 87-100.
Management Plan
Investigators
Dr.
Gregg Bluth has over ten years of experience of
analyzing images of sulfur dioxide from the Total Ozone Mapping Spectrometer
(TOMS). He is an expert in image
analysis and quantifying volcanogenic sulfur dioxide emissions from satellite data. He is experienced in combining ultraviolet
and infrared remote sensing methodologies, and is currently leading a separate
project to validate TOMS retrievals using MODIS data. His research
contributions include two widely cited papers:
the first calculation of sulfur dioxide emissions by the largest
eruption of the satellite era (1991 Mt. Pinatubo, Philippines), and the first
remote sensing evaluation of global volcanogenic contributions of sulfur
dioxide to the atmosphere.
Dr.
Bluth will be responsible for overall project
management, advising graduate students in the project, and comparisons of HIRS SO2
retrievals to the TOMS and MODIS databases.
Dr.
William I. Rose is a volcanologist with more than
35 years research experience. His internationally
known scientific expertise and achievements range from field and laboratory, to
theoretical work, computer modeling, and remote sensing. His groundbreaking work with his Shimeng Wen in 1994 formed the
basis for current methods of infrared retrieval of ash particles. He is well
known for his leadership in multi-sensor and multispectral
analyses of volcanic clouds. He is
currently the leader of an NSF study focusing on physical and chemical
processes occurring during the initial days of interaction with the atmosphere.
Dr.
Rose will be responsible for graduate student advising in the project,
identification of key case studies for database generation, and developing the
HIRS/2 data into comprehensive studies of volcanic cloud processes.
Consultant - Visiting Scholar
Dr.
A.F. Prata has been at Australia's Commonwealth
Scientific and Industrial Research Organization (CSIRO) Laboratories. During this time he conducted research into
evaporation from lakes, development of land surface temperature algorithms,
detection of hazardous volcanic ash, multi-spectral studies of cloud optical
properties, and land radiation budget studies.
Dr. Prata currently works in the Atmospheric
Processes Program, leading the Surface Processes Project. The major focus of the project is on land
radiation budget studies utilizing satellite remote sensing data and a network of
land field sites (CIGSN), operated by CSIRO, and situated at strategic
locations on the Australian continent.
The teams are involved in several international satellite programs,
notably ESA's ERS-1, ERS-2 and ENVISAT, NASA's EOS
and NASDA's ADEOS-I, and ADEOS-II missions. Dr. Prata is a PI
for the ADEOS-I multisensor mission, ADEOS-II GLI
sensor, a member of the ATSR, ATSR-2 and AATSR science teams and a
co-investigator with NASA's interdisciplinary EOS volcanology
team.
Dr.
Prata will spend approximately six months as a
Visiting Scholar at Michigan Tech.
During that time, he will test and refine his methodology for IR
retrievals of SO2, and
instruct our research group in their development and uses, and help develop a
long-term SO2 database from the HIRS dataset.
Reporting and Publication Schedule
Table 4.
Summary of Work Planned*
|
|
Yr
1 |
Yr
2 |
Yr
3 |
|
Proposed Major Tasks |
¨Prata at Michigan Tech (6 mos.) ¨Develop and
validate HIRS/2 retrieval techniques ¨Database
construction, focusing on largest eruptions:
Pinatubo, El Chichón, Hudson ¨Ph.D. study
begins |
¨Database
construction continues with less explosive eruptions ¨Case study
comparisons of HIRS/2 with TOMS and MODIS ¨Refinement of SO2
retrieval methods based on case study results ¨M.S. study begins |
¨Database
construction continues with examination of all explosive eruptions ¨Refinement of SO2
retrieval methods based on case study results ¨Initiate science
application studies ¨M.S. study
concludes ¨Ph.D. study
concludes |
|
Presentations
and Publications |
¨AGU presentations
on tasks in progress ¨Publication on
HIRS/2 methodology |
¨AGU presentations
on tasks in progress ¨Publication(s) on
HIRS/MODIS/TOMS case studies |
¨AGU presentations
on tasks near completion ¨Publications on
long-term SO2 database,
using multi-sensor sources; science applications |
*Note: 2 graduate students will be directly involved
with the Bluth and Rose tasks. Students are typically started with case
study work to learn the retrieval schemes, and basic data and image processing,
before developing their specific research topics.
Resumes
Gregg J.S. Bluth, Associate Professor
Professional Preparation
University of California, Berkeley Geology A.B. 1984
Pennsylvania State University Geochemistry M.S. 1987
Pennsylvania State University Geochemistry Ph.D. 1990
Appointments
1997 - present, Associate Professor, Dept. of Geological Eng. and Sciences, Michigan Technological University (MTU)
1998, NASA Summer Faculty Research Fellow, NASA/Goddard Space Flight Center
1994-1997, Research Professor, MTU
1993-1994, Assistant Research Scientist, Geology Dept., University of Maryland (UMd)
1992-1993, Research Scientist, Universities Space Research Association (USRA), Geodynamics Branch, NASA/Goddard Space Flight Center
1990-1992, Research Associate, USRA
Related Publications
Bluth, G.J.S., W.I. Rose, I.E. Sprod, and A.J. Krueger (1997) Stratospheric loading from explosive volcanic eruptions. J. Geology, 105, 671-683.
Bluth, G.J.S., C.C. Schnetzler, A.J. Krueger, and L.S. Walter (1993) The contribution of explosive volcanism to global atmospheric sulphur dioxide concentrations. Nature, 366, 327-329.
Bluth, G.J.S., S.D. Doiron, A.J. Krueger, L.S. Walter, and C.C. Schnetzler (1992) Global tracking of the SO2 clouds from the June, 1991 Mount Pinatubo eruptions. Geophys. Res. Lett., 19, 151-154.
Krueger, A.J., S. Schaefer, N. Krotkov, G. Bluth, and S. Barker (2000) Ultraviolet remote sensing of volcanic emissions and applications to aviation hazard mitigation. Geophysical Monograph Series 116, Am. Geophys. Un., 25-43.
Rose, W.I., G.J.S. Bluth, and G.G.J. Ernst (2000) Integrating retrievals of volcanic cloud characteristics from satellite remote sensors: a summary. Phil. Trans. Royal Soc. London A, 358, 1585-1606.
Other
Significant Publications
Bluth, G.J.S., T.J. Casadevall, C.C. Schnetzler, S.D. Doiron, L.S. Walter, A.J. Krueger, and M. Badruddin (1994) Evaluation of sulfur dioxide emissions from explosive volcanism: the 1982-1983 eruptions of Galunggung, Java, Indonesia. J. Volc. Geotherm. Res., 63, 243-256.
Bluth, G.J.S., C.J. Scott, I.E. Sprod, C.C. Schnetzler, A.J. Krueger, and L.S. Walter (1995) Explosive SO2 emissions from the 1992 eruptions of Mount Spurr, Alaska. U.S. Geol. Surv. Bull. 2139, 37-45.
Rose, W.I., D.J. Delene, D.J. Schneider, G.J.S. Bluth, A.J. Krueger, I. Sprod, C. McKee, H.L. Davies and G.G.J. Ernst (1995) Ice in Rabaul eruption cloud of 19-21 September 1994. Nature, 375, 477-479.
Schneider, D.J., W.I. Rose, L.R. Coke, G.J.S. Bluth, I.E. Sprod and A.J. Krueger (1999) Early Evolution of a stratospheric volcanic eruption cloud as observed with TOMS and AVHRR, J. Geophys. Res., 104, 4037-4050.
Symonds, R.B., W.I. Rose, G.J.S. Bluth, and T.M. Gerlach (1994) Volcanic-gas studies: Methods, results, and applications. In, Volatiles in Magmas (M.R. Carroll and J.R. Holloway, eds.), Reviews in Mineralogy, 30, 1-60.
Synergistic Activities
-PI of NASA Center of Excellence project (1998-1999), representing the eight Remote Sensing Institute departments through the Michigan Tech campus. This project enabled the purchase of over 60 Sun workstations, and printers and servers and have made a huge impact to the campus-wide ability to: serve the growing undergraduate computing needs; develop and teach computer-based courses; host software workshops; and most recently, host an international workshop featuring volcanic remote sensing.
-PI on Pacific Disaster Center proposal (1999-2001), to develop algorithms and software interface to study volcanic hazards for the Pacific Disaster Center, in Maui, Hawaii. Specific work involved development of sulfate aerosol retrieval method employing thermal infrared sensor data, analytical software, and instruction.
-Co-PI and co-developer of an introductory field course in Utah (1999-present), bringing fundamental geosciences to a highly diverse audience, state and nationwide. PI on several supporting grants which provide scholarship support to underrepresented minorities, pre-service education majors, and secondary school teachers.
-Outreach in volcanic hazard studies in Guatemala (2001-present), focusing on remote sensing evaluation of volcanic activity and development of GIS layers of lava and debris flows, and sediment migration.
-Team member, NASA's TOMS Science Team (2001-present); Earth Observing System Volcanology team.
Collaborators and Other Affiliations
(i) Collaborators
Carn, S. (UM Baltimore Co.); Ernst, G.G.J. (U Bristol); Fawcett, P.J. (U New Mexico); Gibbs, M.T. (UW Madison); Henderson, L.J. (U Bristol); Huntoon, J.E. (MTU); Kennedy, W.A. (MTU); Kostinski, A. (MTU); Krotkov, N.A. (Hughes STX); Krueger, A.J. (UM Baltimore Co,); Kump, L.R. (Penn State); Lait, L.R. (SSAI Goddard); McGimsey, R.G. (USGS); Newman, P.A. (NASA Goddard); Oppenheimer, C. (Open Univ.); Prata, A.J. (CSIRO, Australia); Realmuto, V.J. (JPL); Schaefer, S. (UM Baltimore Co.); Schneider, D.J. (USGS); Seftor, C.A. (NASA Goddard); Torres, O. (NASA Goddard); Tupper, A. (Bureau Met., Australia)
(ii) Graduate and Postdoctoral Advisors
-M.S.: Dr. Hiroshi Ohmoto, Pennsylvania State University
-Ph.D.: Dr. Lee R. Kump, Pennsylvania State University
(iii) Thesis Advisor and Post-Graduate Sponsor, last 5 years
-S. Guo (current); C. Riley (current, co-advise); J. Shannon (current); S. Reif (current); S. Bunzendahl (current); Y. Gu (2000, co-advise, MTU); Robb Cookman (2000, UP Engineers, Marquette, MI); S. Barker (2000); G. Mayberry (1999, co-advise, Smithsonian GVP); E. Constantine (1998, co-advise, Inst. App. Geospatial Tech., Auburn, NY)
-M. Watson (2001, MTU)
-Totals: 1 post-doc, 4 Ph.D., 8 M.S.
William I. Rose, Professor
Professional Preparation
Dartmouth College, Geology, Ph.D.,1970
Dartmouth College, Geography,Geology, A.B., 1966.
Appointments
Michigan 12/99-present: Interim Director, Remote Sensing Institute
Technological 9/79-present: Professor of Petrology
University 6/90-6/98: Department Chair
9/74-9/79: Associate Professor of Petrology
9/70-9/74: Assistant Professor of Petrology
External 1/99-12/99: Visiting Leverhulme Fellow, University of Bristol, UK
8/85-6/86: Visiting Scientist, Los Alamos National Laboratory
1/81-present: Geochemist (W.A.E. Basis), USGS, Cascades Volcano Observatory, WA; Alaska Volcano Observatory, Anchorage; VDAP.
8/77-8/78: Senior Visiting Scientist, Upper Atmosphere Group, National Center for Atmospheric Research, Boulder, CO.
8/77-8/78: Visiting Scientist, Branch of Isotope Geology, USGS, Denver, CO
Related Publications
Rose, W.I., G.J.S. Bluth and G.G.J. Ernst, 2000, Integrating retrievals of volcanic cloud characteristics from satellite remote sensors--a summary, Philosophical Transactions of Royal Society, Series A, vol. 358 , pp. 1585-1606.
Rose, W.I. and Mayberry, G.C. (2000) Use of GOES thermal infrared imagery for eruption scale measurements, Soufriere Hills, Montserrat. Geophys. Res. Lett., 27, 3097-3100.
Yu, T and Rose, WI (2000) Retrieval of sulfate and silicate ash masses in young (1-4 days old) eruption clouds using multiband infrared HIRS/2 data. AGU Monograph 116, Remote Sensing of Active Volcanism, 87-100.
Rose, W.I., D.J. Delene, D.J. Schneider, G.J.S. Bluth, A.J. Krueger, I. Sprod, C. McKee, H.L. Davies and G.G.J. Ernst (1995) Ice in Rabaul eruption cloud of 19-21 September 1994. Nature, 375, 477-479.
Wen, S. and Rose, W.I. (1994) Retrieval of sizes and total masses of particles in volcanic clouds using AVHRR bands 4 and 5. J. Geophys. Res., 99, 5421-5431.
Other
Significant Publications
Mayberry, G.C., W.I. Rose and Bluth, G.J.S. (2002, in press) Dynamics of the volcanic and meteorological clouds produced by the December 26, 1997 eruption of Soufriere Hills volcano, Montserrat, W.I. Special Publication of the Geological Society of London, The 1995-99 eruption of Soufriere Hills volcano.
Schneider, D. J., W. I. Rose, L. R. Coke, G. J. S. Bluth, I. Sprod and A. J. Krueger, 1999, Early Evolution of a stratospheric volcanic eruption cloud as observed with TOMS and AVHRR, J. Geophys. Res., 104; 4037-4050.
Constantine, E.K., Bluth, G.J.S. and Rose, W.I. (2000) TOMS and AVHRR sensors applied to drifting volcanic clouds from the August 1991 eruptions of Cerro Hudson. AGU Monograph 116, Remote sensing of Active Volcanism, 45-64.
Rose, W.I., F.M. Conway, C.R. Pullinger, A. Deino and W.C. McIntosh, 1999, A more precise age framework for late Quaternary silicic eruptions in northern Central America, Bull. Volc., 61, 106-120.
Bluth, G. J. S., W. I. Rose, I. E. Sprod and A. J. Krueger, 1997, Stratospheric loading from explosive volcanic eruptions, J Geology, 105: 671-683.
Synergistic Activities
Since 1970: Efforts to help build infrastructure within volcanic hazards efforts in third world countries funded by NSF International Programs and OFDA/USGS/VDAP grants: Guatemala, Decade Volcano Workshop, 1993; Ecuador, COSPEC training, 1989; El Salvador, Synergistic efforts at post war science contacts, 1996-2000; Mexico, Ph.D. student training, 1995-98; Chile, initial research collaborative visit,1989. Field projects in Guatemala and El Salvador funded by USGS/OFDA. Support for two Central American students via USGS/VDAP (CAMI).
Since 1980: Multi-campus educational efforts: Video based educational efforts in Optical Mineralogy,1982;Volcanic Rock Textures,1985;and video field trips: 1987-1993;Volcanic Rocks and their vent areas, Industry Short Courses (field trips and lectures);1976-1985; Graduate student field trip efforts,1997 (Western Mexico); NSF funded International Travel Grant to IAVCEI Bali meeting, and associated Hawaii and Pinatubo field trips, July 2000.
Since 1986: Development of volcanic cloud detection algorithms for meteorological satellite detectors, and communication about the use of these for hazard mitigation; continual outreach to advanced users from regional Volcanic Ash Aviation Centers; extensive web-based communications effort; International Volcanic Cloud Remote Sensing Workshop, 2001.
Since 1992: Development of Michigan Tech Remote Sensing Institute. Co-organizer and Interim Director of an institute with 35 faculty members from nine different MTU departments, Development of an interdisciplinary minor program in remote sensing; many interdisciplinary seminar series and several new interdisciplinary classes.
Since 1992: NASA EOS IDS Science group member, Volcano Remote Sensing.
Collaborators and Other Affiliations
(i) Collaborators
A. Bernard (University of Bruxelles); C. Chesner (E Illinois Univ); G. Ernst (Univ. of Bristol, UK); L. Flynn (University of Hawaii); H. Graf (Max Planck Inst Meteorology); A. Harris (University of Hawaii); N. Krotkov (Raytheon ITSS); A. Krueger (NASA Goddard); F. Prata (CSIRO, Australia); V. Realmuto (NASA/JPL); S. Self (University of Hawaii); C. Textor (Max Planck Inst Meteorology)
(ii) Graduate and Postdoctoral Advisors
R.E. Stoiber, Dartmouth College, Emeritus Professor, deceased.
(iii) Thesis Advisor (17) and Post-Graduate Sponsor (2) last 5 years
Totals: 40 M.S., 13 Ph.D.
D.J.
Schneider, USGS Alaska Volcano Observatory; G.C. Mayberry, Smithsonian
Institution GVP/ USGS; P. Kimberly, Smithsonian Institution GVP; C. Pullinger, Finca manager, El
Salvador; D. Sofield, GeoEngineers,
Tacoma, WA; D.J. Delene, CIRES, U. Colorado; E.
Constantine, GeoInsight International, Ojai, CA; H.L.
Shocker, SAIC, McLean,VA; J.W. Vallance,
McGill U.; A.N. Pilant, EPA, Raleigh, NC; G.
Carrasco-Nunez, UNAM Mexico; J. Graf, NASA; L.R. Coke, MTU; I.M. Watson, MTU
(post-doc); T. Yu, (current post-doc); C. Riley, S. Guo,
O.P. Mills, K. MacPhail (current students).
Fred
Prata, Senior Principal Research Scientist
Professional Preparation
Imperial College, London University Physics B.S. 1975
Imperial College, London University Atmospheric Physics MS 1978
University of Oxford
Stratospheric dynamics Ph.D.
1980
Appointments
1998-Present, Senior Principal Research Scientist, CSIRO Remote sensing team, Aspendale, Victoria, Australia.
1987-1998, Principal Research Scientist, CSIRO
Atmospheric research, Aspendale, Victoria, Australia.
1984-1987, Group leader, CSIRO Remote sensing group, Floreat Park, Perth, Western Australia.
1983-1984, Research Fellow, School of Physics and Geosciences, Curtin University, Perth, Western Australia.
1980-1983, Post-doctoral fellow, Atmospheric physics Department, University of Oxford, England.
Related Publications
Prata, A. J., and Grant, I. F. (2001) Retrieval of microphysical
and morphological properties of volcanic ash plumes from satellite data:
applications to Mt Ruapehu, New Zealand. Quarterly
Journal of the Royal Meteorological Society, 127 (576B): 2153-2179.
Prata, A. J. (1998) Comment on "Comparison of atmospheric
correction models for thermal bands of the advanced very high resolution
radiometer over FIFE" by S. N. Kalluri and R. O.
Dubayah. Journal of Geophysical Research, 103 (D6):
6237-6241.Abstract Available
Prata, A. J. (1989) Observations of volcanic ash clouds in
the 10-12 um window using AVHRR/2 data. International Journal of Remote
Sensing, v. 10, 751-761.
Prata, A. J., I. J. Barton,
and J. Kingwell (1993) Aircraft hazard from
volcanoes, Nature, 366,199.
Prata, A. J., and P.J.
Turner (1997) Cloud top height determination from the ATSR, Remote Sensing
Environment, 59, 1-13.
Other
Significant Publications
Prata, A. J., Bluth, G., Rose,
B., Schneider, D., and Tupper, A. (2001) Comments on "Failures in
detecting volcanic ash from a satellite-based technique". Remote Sensing
of Environment, 78 (3): 341-346.
Sobrino, J. A., Reíllo, S., Cuenca, J., and Prata, A. J.
(2001) Algorithms for estimating surface temperature from ATSR-2 data. In:
Looking down to earth in the new millennium: ERS-Envisat
symposium, Gothenburg, Sweden (ESA SP, 461). Noordwijk,
The Netherlands: European Space Agency. 13 p.
Prata, A. J. (1989) Infrared radiative
transfer calculations for volcanic ash clouds. Geophysical Research Letters, v.
16, 1293-1296.
Prata, A., Barton, I. J., Johnston,
J.W., Kingwell, J., F. and Lamo,
K., (1991) Hazard from volcanic ash, Nature, 354(6348), 25.
Prata, A. J. and I.J.
Barton (1993) A multichannel, multiangle
method for determining infrared optical depth of semi-transparent high-cloud
from an orbiting satellite I: Formulation and simulation, J. Appl. Meteorology, 32(10), 1623-1637.
International
Scientific Investigations and Consultancies:
·Principal
Investigator for Rutherford Appleton Laboratory Expert Support Team: "Land
surface temperature Algorithm development"
·Aviation
Industry Support: "Volcanic ash and trajectory modeling research"
·Principal
Investigator for ENVISAT project: "Retrieval of volcanic ash cloud
properties from MERIS/AATSR"
·Principal
Investigator for ADEOS-I project: "Radiative, chemical
and physical properties of stratospheric aerosols"
·Principal
Investigator for ADEOS-II project: "Surface radiation budget studies with
the ADEOS-II GLI"
·Co-
Investigator for EOS/MODIS/ASTER project: "Validation of land surface
temperatures and emissivities from the
EOS/MODIS/ASTER"
·Co-
Investigator for ENVISAT/AATSR project: "Calibration and validation of the
ENVISAT/AATSR"
·Consultant
to the Remote Sensing Committee of the Australian Space Board for the ATSR and
ATSR-2 and the Global Atmospheric Methane sensor (GAMS)
National
and International Committees
·Chairman
of a working group (under the auspices of the International Radiation
Commission) on calibration of the TIROS Operational Vertical Sounder from
1985-1987.
·Chairman
of the Volcanic Ash Detection and Aviation Safety committee, 1988-1990.
·Organizer
and Chairman of the 1st Australia AVHRR Users' meeting, Perth, 22-24
October 1986.
·Land
science team leader of the European Space Agency's ATSR science team, 1991-
1996.
·Land
science team member of the European Space Agency's ATSR-2 science team, 1995-
present.
·Chairman
of the IAMAS Symposium 'Volcanoes and Climate", Melbourne, 1-9 July 1997.
·Co-convener
of the IAMAS/IAVCEI symposium, Birmingham, England, "Volcanism-Mechanisms
and Consequences", 18-30 July 1999.