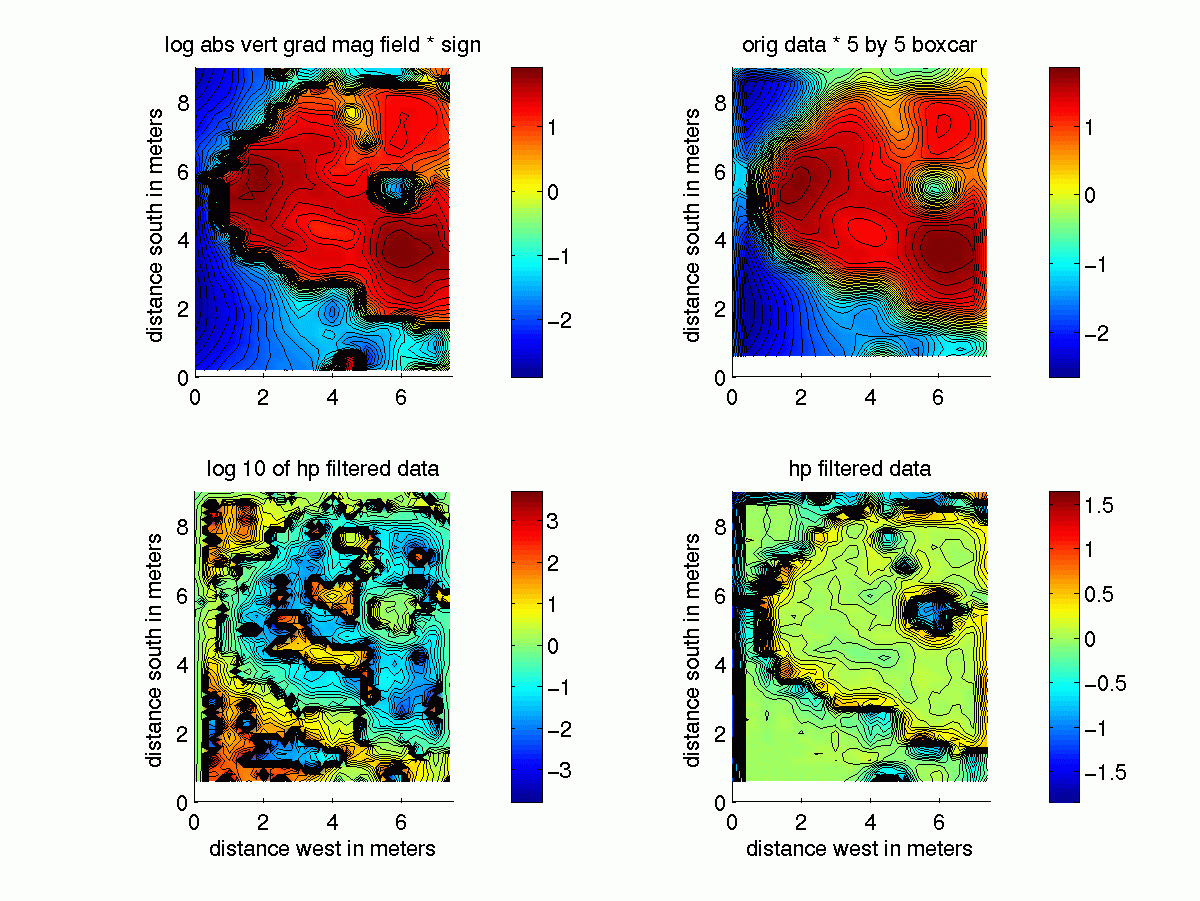
Magnetic gradiometer data were obtained over a site at which
old maps indicate as a carpenter shop. Data were acquired on a grid 7 m
wide by 9 m long. The line spacing was 0.5 m and data spacing along
the line was about $
m.The gradiometer data without processing are not shown but are quite
similar to the plot in the upper right hand panel. A rough
half circle of high gradient is present. Additional details including
at least two dipole anomalies are visible within the half circle.
I processed the data to yield additional details as follows. I displayed
logarithm to the base 10 of the data in the upper left hand panel as
smoothed (low pass filtered) the data by convolving it which a five by
five uniform panel. The results are shown in the panel on the upper right.
I subtracted this from the original data, and have presented this difference
in the panel on the lower right. This process is thus a high pass filter,
and is intended to remove or attenuate larger features and reveal smaller
features. I plotted the logarithm to the base 10 of these high pass
filtered data in the lower left hand panel.