
Summary
The level of seismic activity at the volcano increased markedly, with the occurrence of a major swarm of volcano-tectonic earthquakes beneath the crater on 1-2 November. This swarm was the most intense recorded since dome growth began in November 1995. Deformation measured by EDM (total station) and GPS techniques has remained at a low rate. The sulphur dioxide flux has returned to low levels of a few hundred tonnes per day. Visual observations have been restricted by persistent low cloud. Several moderate rockfalls were observed from the eastern side of the new dome on 29 October, but since then the dome activity has decreased. The scientific team recommended an increase in the alert level from Amber to Orange at 06:15 on 2 November, because of an increase in the seismic activity.
Visual observations
Viewing conditions have been poor for most of the week, with only limited views of the crater area possible. Good views were obtained on the morning of 29 October, when several rockfalls from the eastern face of the October 1 dome occurred during and after a thunderstorm, and produced small ash clouds. The deposits from these rockfalls went further down the Tar River valley that any previous rockfalls since the 17/18 September explosion. On 1 November, more deposits were observed in this area, suggesting that some parts of the eastern face had collapsed. Other changes to the dome were limited to a general increase in the height of the dome, and the appearance of a small stubby spine on top. Observations on 2 November suggested that there was a new area of activity to the northwest of the new dome, on the edge of the scar feature caused by the 17/18 September explosion. This area was steaming and degassing vigourously, and seemed to be deformed, suggesting that a new intrusion was taking place.
Seismicity
Earthquake types: 27 October to 02 November 1996
These earthquake counts are of events that triggered the short-period seismic network event recording system between 0000 to 2400 each day.
Date      VT        LP        Hybrid    RF

27 OCT 96 23        1         0         7
28 OCT 96 3         0         0         3
29 OCT 96 7         0         0         8
30 OCT 96 30        3         0         5
31 OCT 96 0         4         0         1
01 NOV 96 110       4         0         7
02 NOV 96 303       3         1         6
Volcano-tectonic earthquakes have dominated, with most of the earthquakes occurring within swarms at shallow depths beneath the crater. The swarms began on 21 October, and have had variable durations and reoccurrence times.
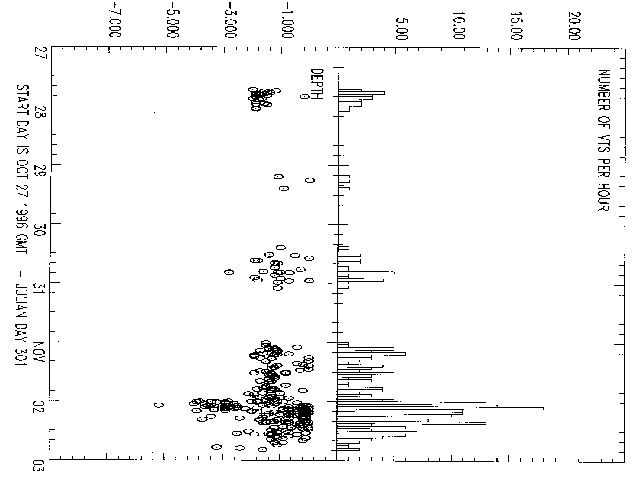
The earthquake swarms occurred from 17:22 on 27 October to 01:13 on 28 October (84 events), from 14:46 to 23:35 on 30 October (25 events), and 00:27 on 01 November to 20:31 on 02 November (413 events). Many of these VTs were large enough to be located, and most occurred at shallow depths (< 2 km). The swarm on 1-2 November included a set of deeper events at 3-4 km beneath the crater, which were present from only 00:00 until 04:00 on 2 November (FIGURE 1). This swarm was the largest VT swarm (in terms of total numbers of events and duration) recorded since the start of dome growth in November 1995. Similar swarms of VTs occurred in the weeks prior to the 17/18 September explosion, although these swarms were of shorter duration, occurred more frequently, and had no deeper earthquakes.
The number of other types of seismic events has been very low during the period. Only a few long-period earthquakes were recorded, and these were of low magnitude. The number of rockfall signals has remained low, with less than ten per day triggering the seismic event recording system.
Ground Deformation
The MVO Total Station was used to make EDM measurements of the eastern, northern and western triangles during the week. All the readings were consistent with the long-term trends on these lines.
The northern triangle was measured on 27 October, and included measurement of the Farrells Road to Upper Farrells line, which had not been measured since December 1995. Atmospheric corrections were used on this line for the first time, and so the results are not directly comparable with previous measurements. The lines from Windy Hill and St Georges Hill to Farrells Road lengthened by 12.5 mm and 3 mm respectively since last measured on the 21 October. These lines are quite erratic, but show long-term trends of little or no change.
Measurements were also made between the Tar River Estate House and Castle Peak on 28 October, which is the first time this line has been measured since 25 August. The original reflector was destroyed during the 17/18 September explosion, and so the line length cannot be compared to previous measurements. The eastern triangle of lines between Long Ground, Whites and Castle Peak was measured on 02 November, and showed shortening of lines to Castle Peak by about 9 cm since 23 October. These measurements are consistent with the long term trend of line shortening at a rate of 1 cm per day, which has been maintained since mid-July 96.
Radial lines on the western flank of the volcano were measured on 01 November, between Upper and Lower Amersham, Dagenham and Chances Steps. Most of these lines are stable, except for the line between Upper and Lower Amersham which shows an irregular +/-5 cm variation, with no consistent change. The reason for this variation is not known.
Three GPS surveys were conducted around the volcano this week. Occupations were made of the network covering the whole volcano on 30 October and 2 November. The 30 October survey included the Tar River site, which had not been occupied since late August. A network covering the western flank of the volcano was occupied on 31 October. Changes in slope length have not been significant at the 95% confidence level, with all variations within two sigma of the measurement error. This indicates the absence of a widespread deformation field associated with the eruption.
Dome Volume Measurements
No estimates of the dome volume have been possible this week, due to a combination of poor weather and the increase in the level of seismic activity which made flying close to the dome less advisable.
A survey of the lower Tar River valley was made on 28 October from the Tar River Estate House, using the range-finding binoculars. This survey will help determine the volume of material that has been deposited in the valley, and quantify the amount of erosion that has taken place since the last survey.
Gas, Ash and Rainwater Measurements
Measurements of sulphur dioxide flux from the volcano were made on October 27 (434 tonnes / day), 28 (498 t/d) and 31(311 t/d), and 2 November (267 t/d), using the correlation spectrometer. All the COSPEC measurements were made by running traverses beneath the volcanic plume along the west coast road. The values were far lower than the maximum average measurement of 1500 t/d on 24 October.
The SO2 tubes at sites around Amersham and Plymouth are collected every two weeks and sent to the UK for analysis. Analysis of tubes collected during September show a marked increase in SO2 levels to >250 ppb immediately after the 17/18 September explosion. No ash was sampled this week. Weekly collection and analysis of rainwater continues. The rainwater collected in and around Plymouth continues to be quite acidic, although there was an slight increase in pH this week, with the lowest value being over 3 at Upper Amersham.
Staff Changes
There were no staff changes this week.
Current scientific staff are:
Richard Robertson, Simon Young, Paul Jackson, Paul Cole, Gill Norton,
Rod Stewart, Angus Miller, Nikki Stevens and Ricky Herd.
Figure 1: Number of located volcano-tectonic earthquakes per hour (top) and calculated hypocentral depths (bottom), using data from the short-period seismic network.