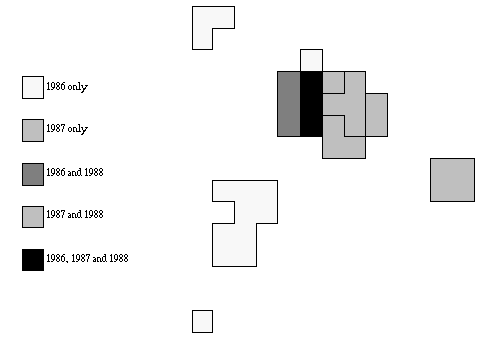

Comparison of the TM band 7 thermal anomalies around Caliente taken from Andres and Rose, 1993. The lone square in the lower portion of the map corresponds with one TM pixel. North is at the top.

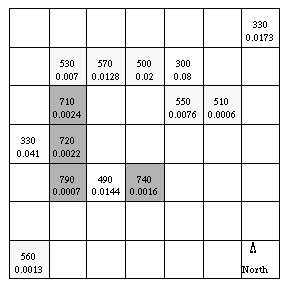
Subpixel temperature map of the anamoly seen in the image below. The upper number in each square represents the thermal anomaly temperature in degrees C. The lower number in each square is the corresponding f or fraction of the pixel at that emitting temperature. Empty squares do not contain any significant thermal anomaly.

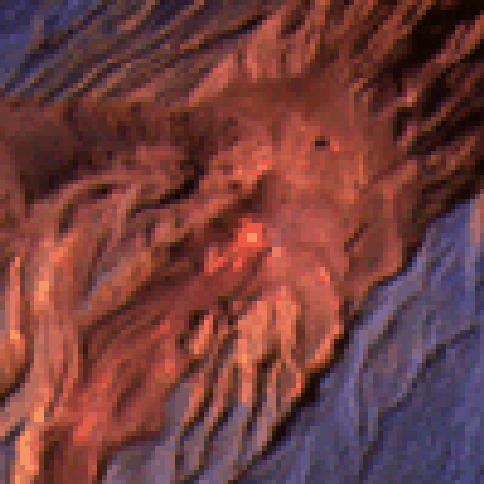
100 X 100 pixel close up of Santiaguito showing the thermal anomaly around Caliente. Image was acquired October 25, 1987 with TM bands 754 in the RGB respectively.