 IMPORTANT: When done viewing an image, put the
cursor over the image and hit the "q" key. This will kill the image.
IMPORTANT: When done viewing an image, put the
cursor over the image and hit the "q" key. This will kill the image.
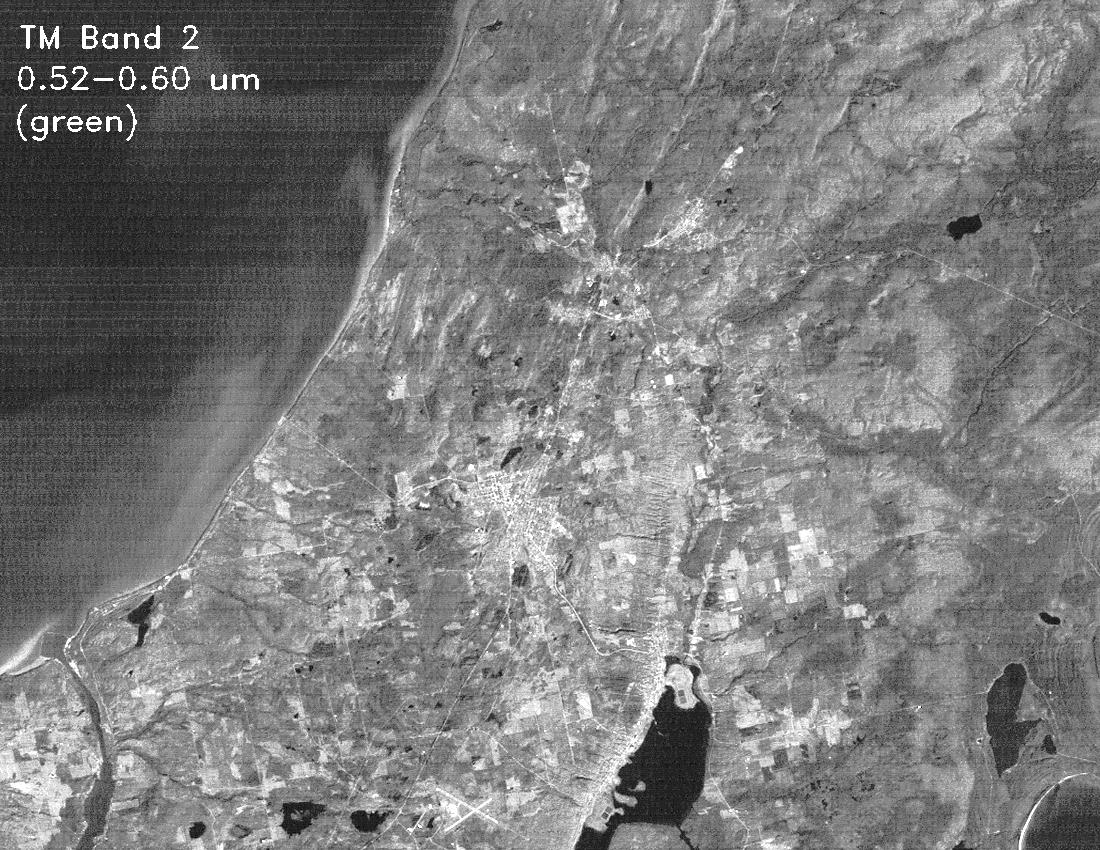
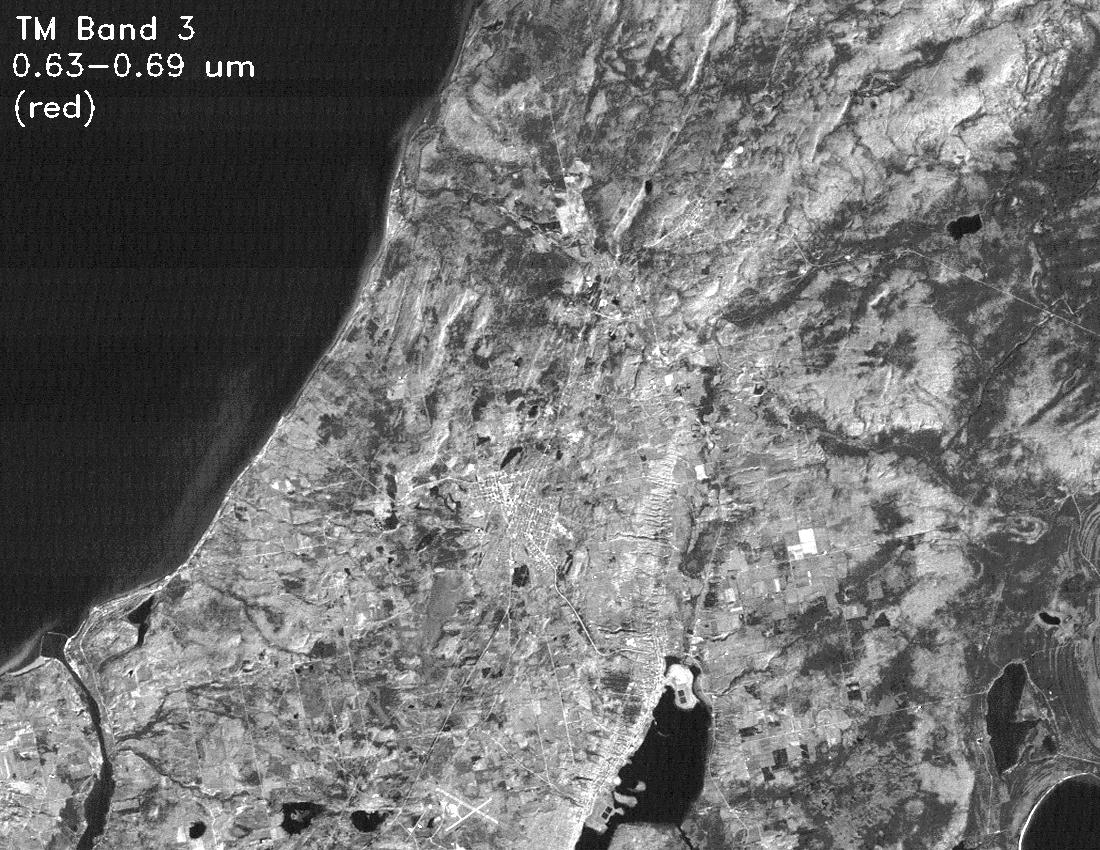
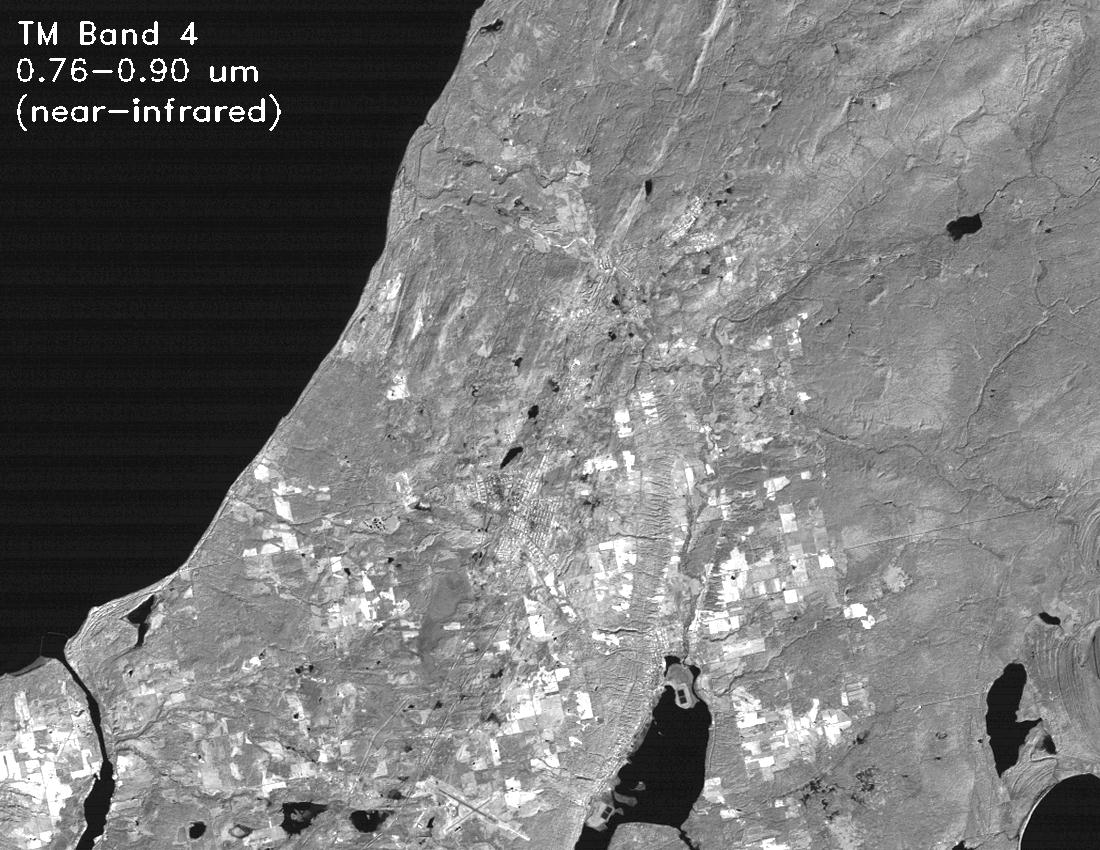
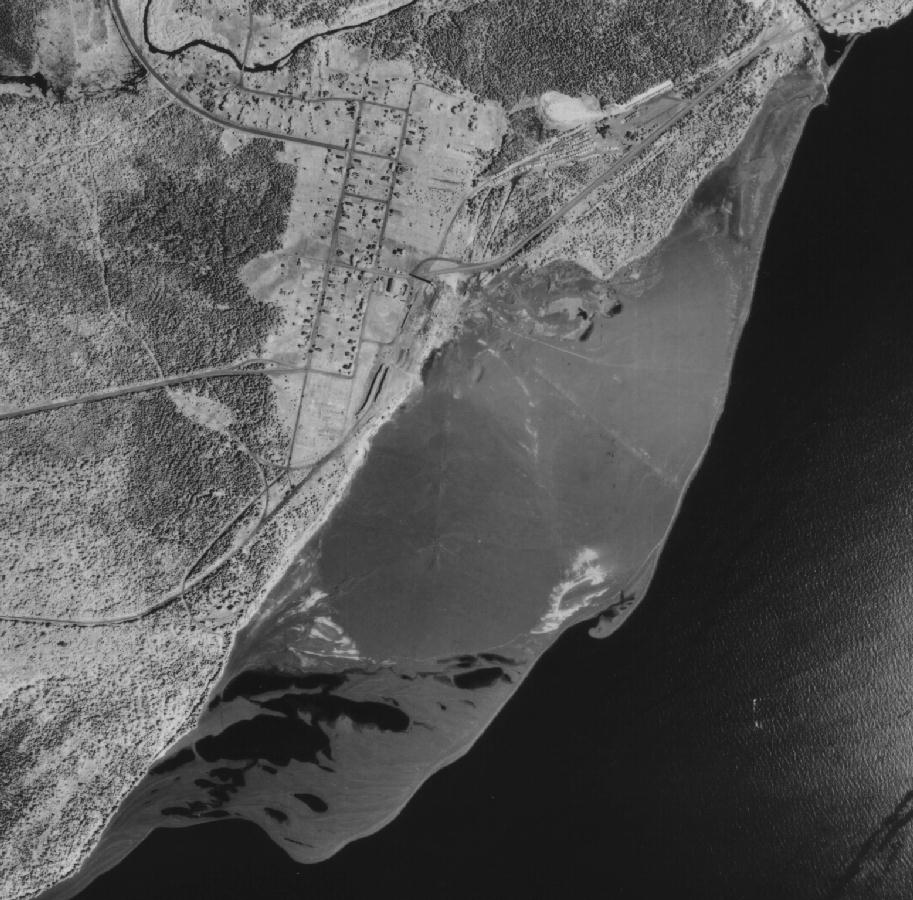
The images on this page were collected by the Landsat Thematic Mapper (TM) sensor and by the Spot Panchromatic (PAN) sensor. The Landsat image was collected in October 1986, while the Spot image is from September 1991.
IMPORTANT: When done viewing an image, put the
cursor over the image and hit the "q" key. This will kill the image.
 Average Orbital Height: 830 km (515 miles)
Spatial Resolution: 10 meters
Records Data in 1 Wavelength Interval
Data Range: Green to Red (0.51 to 0.73 microns)
Average Orbital Height: 830 km (515 miles)
Spatial Resolution: 10 meters
Records Data in 1 Wavelength Interval
Data Range: Green to Red (0.51 to 0.73 microns)
Average Orbital Height: 700 km (440 Miles)
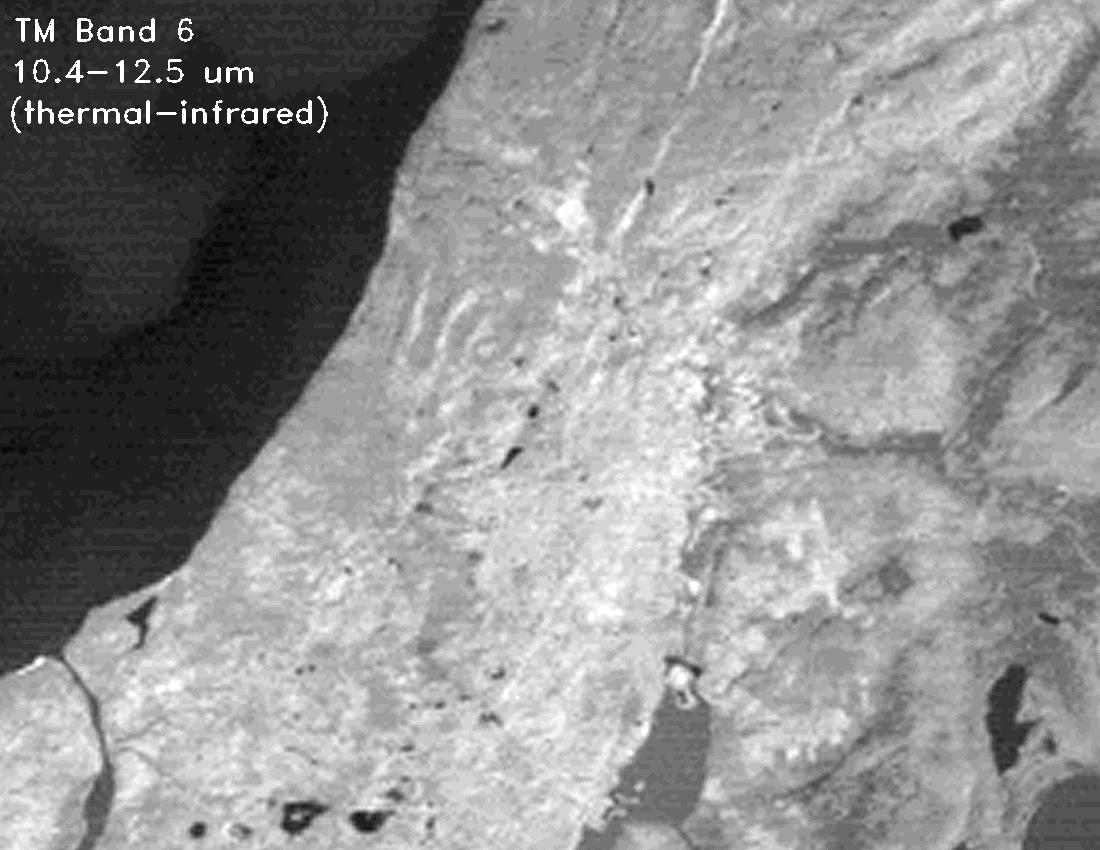
Spatial Resolution: 30 meters, except
band 6 which is 90 meters.
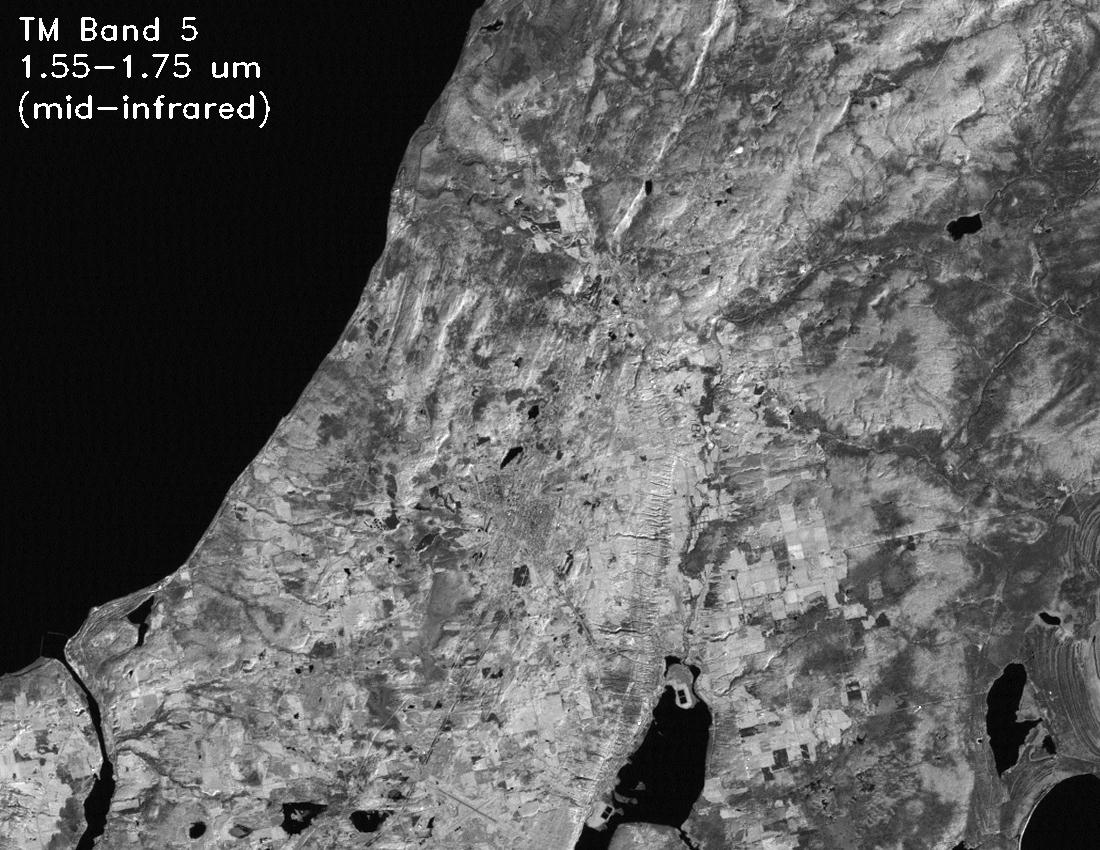
Records Data in 7 Wavelength Intervals
(bands)Bands 1,2,3,4,5, and 7 record reflected
energy
Band 6 records emitted thermal (heat)
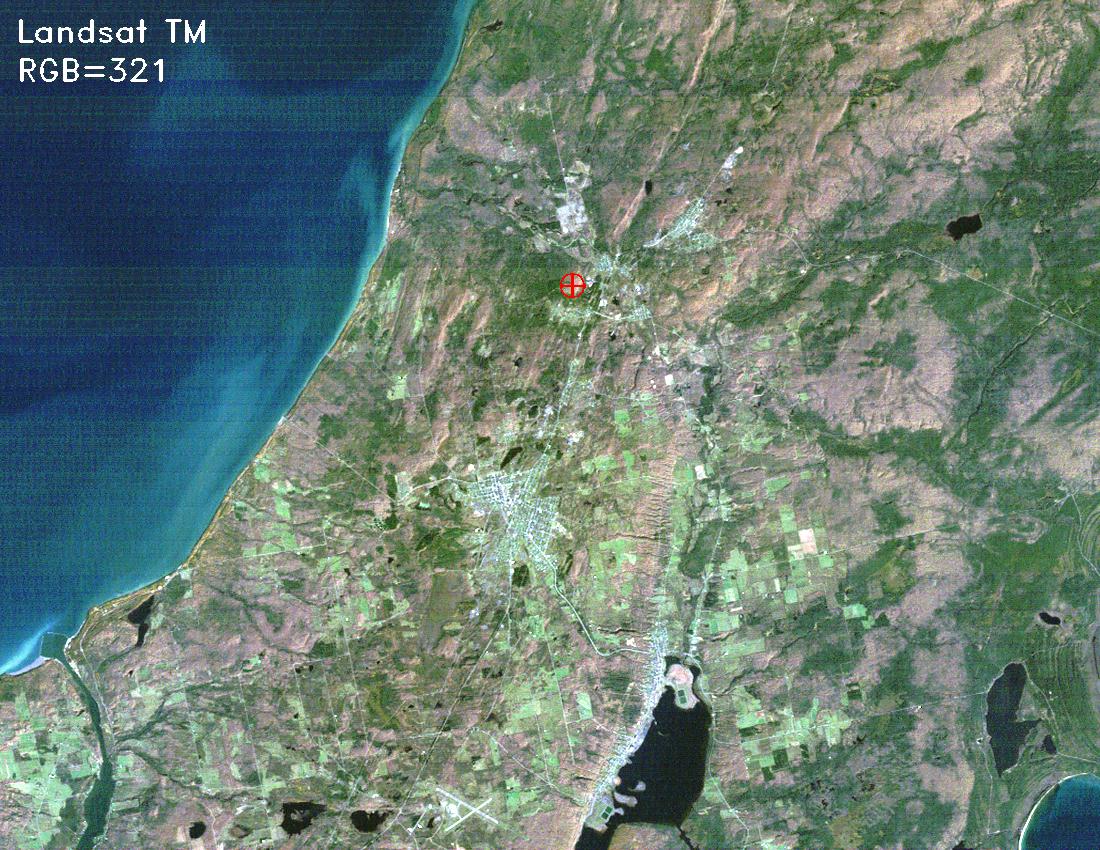
energyTo produce a true color image , the red satellite data (band3) is put in the red component of the color monitor, the green satellite data (band 2) is put in the green component of the color monitor, and the blue satellite data (band 1) is put in blue. Here is an example of a true color image.
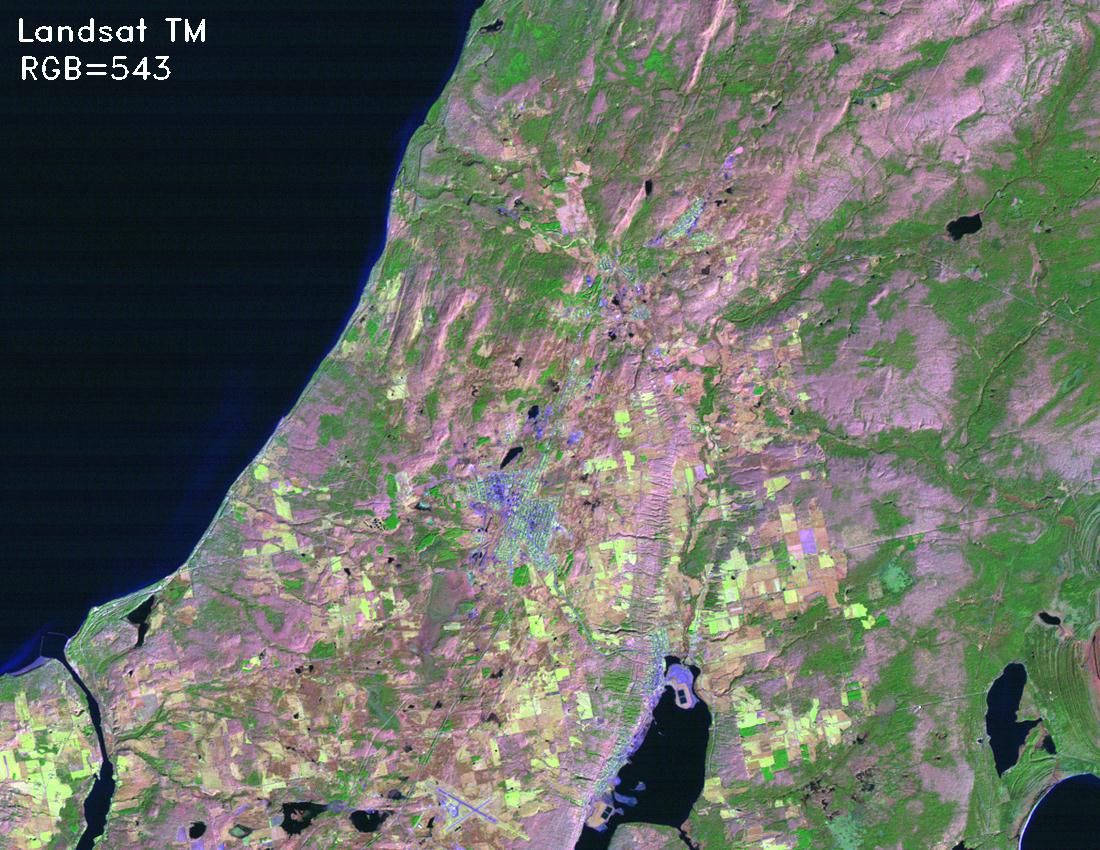
To produce a false color image , any of the bands can be put in any of the monitor color "guns". The band combination which is used can be changed to highlight the desired feature or phenomena. Here is an example of a false color composite , which was produced by putting TM band 5 in red, band 4 in green and band 3 in blue. The notation for this band combination is "543", and the images below use the same naming convention.
Keweenaw Peninsula
Click on the desired band combination:
Landsat TM 321
Landsat TM 432
Landsat TM 543
Landsat TM 6
Copper Harbor
Click on the desired band combination:
Landsat TM 321
Landsat TM 432
Landsat TM 543
Spot PAN
Cliff Drive
Click on the desired band combination:
Landsat TM 321
Landsat TM 432
Landsat TM 543
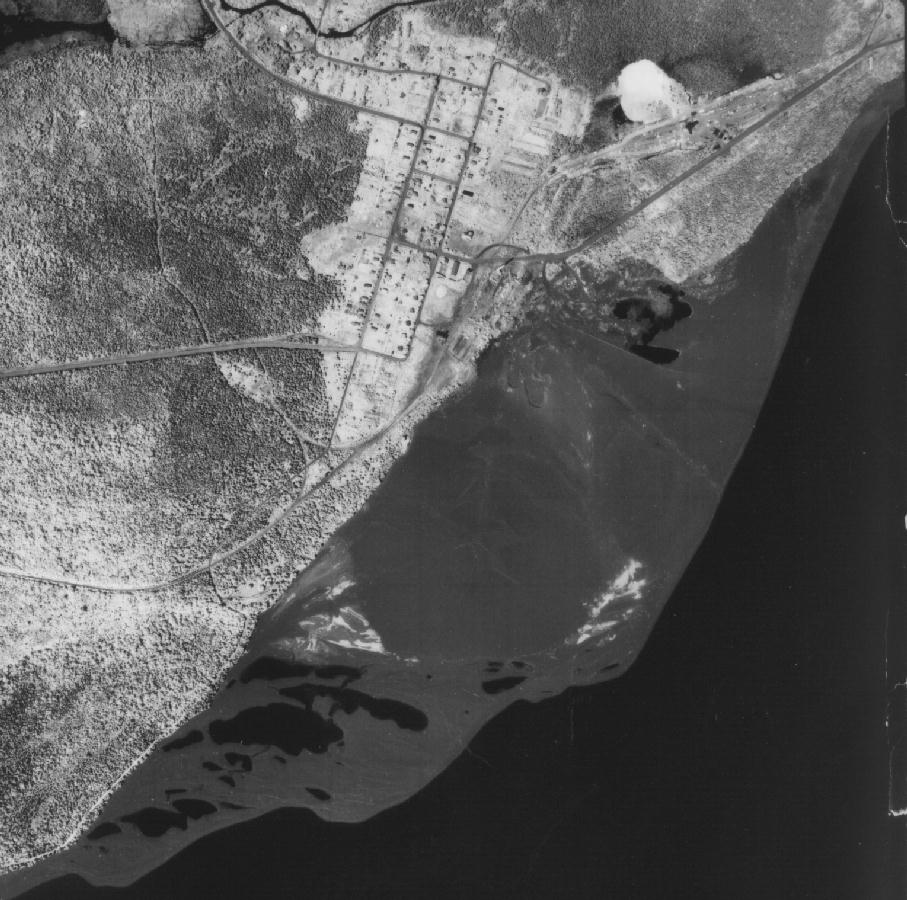
Gay
Click on the desired band combination:
Landsat TM 321
Landsat TM 432
Spot PAN
Airphoto 1954
Airphoto 1964
Airphoto 1978
Freda
Click on the desired band combination:
Landsat TM 321
Landsat TM 453
Spot PAN
Portage Lake
Click on the desired band combination:
Landsat TM 321
Landsat TM 432
Landsat TM 543
Spot PAN
Spot PAN: Closeup of Houghton
Twin Lakes
Click on the desired band combination:
Landsat TM 321
Landsat TM 453
Isle Royale
Click on the desired band combination:
Landsat TM 432
Landsat TM 543
 Back up to Home Page
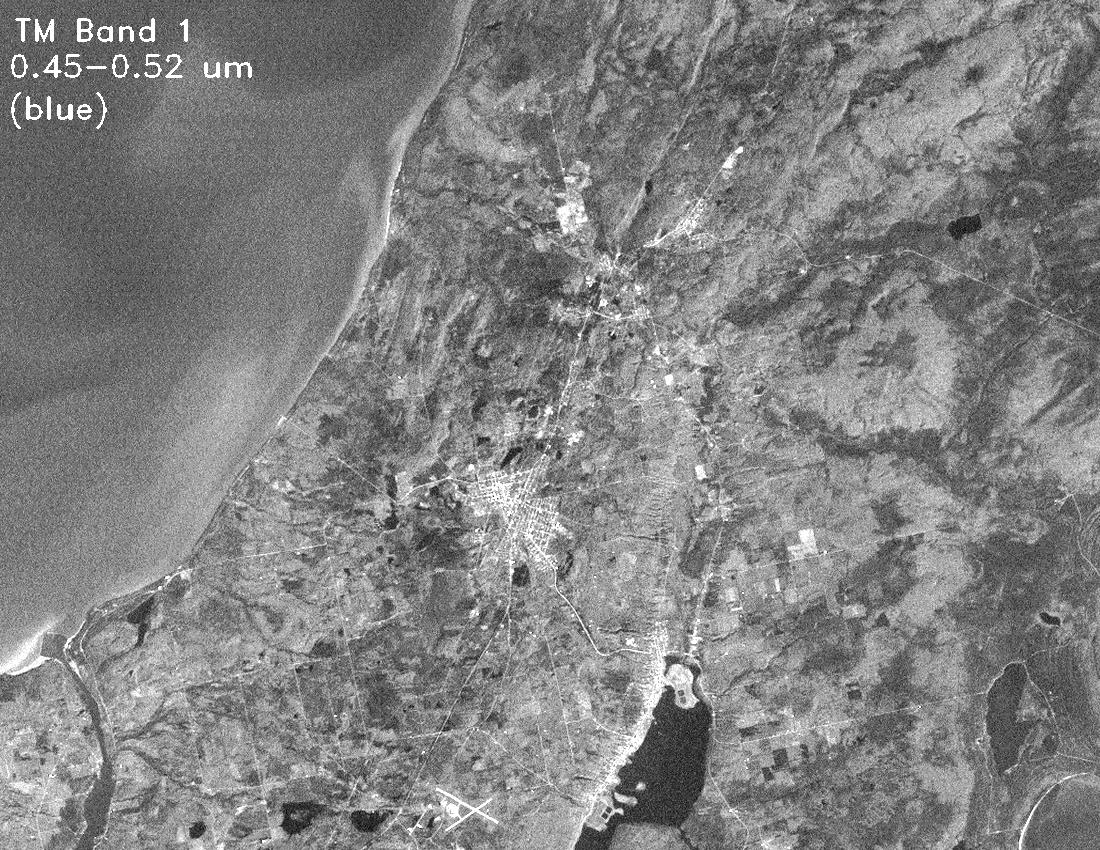