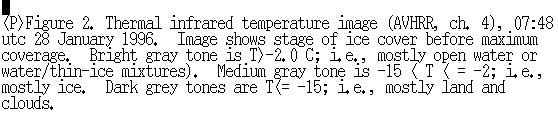
 Figure 2 caption
 4 February
1996 Great Lakes Ice Cover (60 kb)
Figure 1 caption
4 February
1996 Great Lakes Ice Cover (60 kb)
Figure 1 caption
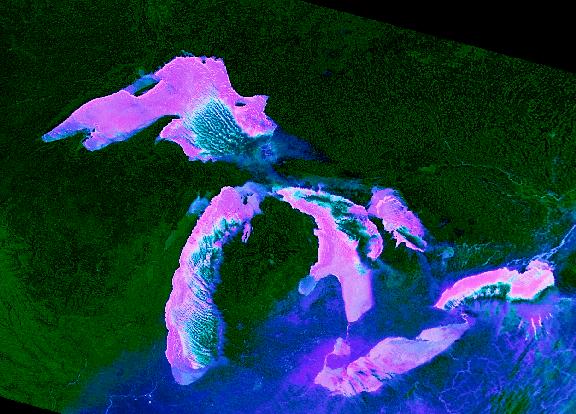
Late January and early February 1996 brought several consecutive days of sustained low temperatures (-30 to - 50 C) to the upper midwest, cooling all five of the Laurentian Great Lakes sufficiently to form nearly complete ice covers. Complete ice cover is an ephemeral and not necessarily annual phenomenon, fortuitously captured through an unusually cloud free atmosphere by the NOAA 14 AVHRR (Advanced Very High Resolution Radiometer) sensor at 08:11 utc (03:11 est) on February 4. Figure 1 presents an unusual, synoptic glimpse of maximum Great Lakes ice cover. This brief note points to some of the features visible in this singular image.
Ice cover is a major component of the Great Lakes annual cycle, with significant effects on weather, shipping and shoreline processes. To the geophysical community, these effects are expressions of mass and energy fluxes at the lakes' surfaces. As ice cover physically restricts evaporation, it also limits latent and longwave heat loss, and consequent "lake effect" precipitation. Solar loading to the lake decreases as ice cover increases, lessening radiative heating and reducing light available for photosynthesis. Ice cover also influences thermal/density structures, with consequent effects on convective overturn, oxygenation, currents and lake level. Because ice cover is sensitive to climate trends, ice duration and extent may be used in climate change analysis.
The ability to observe ice throughout its season is central to understanding Great Lakes ice dynamics. Synoptically clear sky views such as Figure 1 are rare (and are in large part due to the extensive ice cover limiting evaporation and cloud condensation). The NOAA Satellite Active Archive was searched for all AVHRR images between January 23 and February 12, and for intermittent images between February 12 and 24. Only a few images approach the degree of cloud free skies seen here, and most of those few are concentrated between approximately February 2 and 5, the estimated period of maximum areal ice extent.
Figure 1 is a false color composite of NOAA 14 AVHRR thermal infrared channels 4 (10.3-11.3 um) and 5 (11.5-12.5 um) and their difference (4 minus 5). Radiometric processing of the raw data was limited to conversion from sensor counts to temperature (using standard NOAA calibration algorithms) and warping to a Lambert azimuthal projection. Spatial resolution is approximately 1.1 km per pixel. Image brightness is proportional to temperature, and image colors and intensity were assigned subjectively via interactive stretching of the data histograms. This is approximately equivalent to level slicing the image into temperature regimes, allowing visual discrimination of ice, clouds and land. This subjective image classification is supported by field observations of ice and weather conditions on the Keweenaw and Upper Peninsulas of Michigan on Lake Superior.
Ice first forms in shallow and protected waters (e.g., Saginaw Bay, MI on Lake Huron), as opposed to open lake where prior to reaching thermal equilibrium, turbulent mixing continually supplies the surface with warmer water from below. The old ice (blue, some green) is colder than new ice due primarily to its greater thickness, and probably also to greater degrees of snow cover which tends to mimic subzero air temperatures. Greater thickness probably is due to longer periods of in situ growth, and possibly mechanical thickening through compression of floes during high wind episodes. Note that some areas of old ice are 'misclassified' by color as land (e.g., Green Bay, WI on Lake Michigan; Thunder Bay, ONT on Lake Superior). These are areas of oldest ice, which tend to be thickest and coldest.
The pink-magenta pixels are interpreted as new ice primarily on the basis of their temperature (-17 to -3 C), but also by their vast areal extent and the presence of fracture zones. The highest temperature in the entire scene is -1.5 C, indicating that even the warmest lake pixels contain at least some fraction of ice (a pure water pixel should have a temperature of not less than approximately -0.5 C). New ice is is thinner (in the range of 0-10 cm?) and thus warmer due to greater heat conduction.
The white or brighter pink jagged lines in north central Lake Superior, Georgian Bay, and southern Lake Ontario are fracture zones or open water leads. The temperatures in these areas range from -4 to -2 C, indicating that even the warmest pixels contain some fraction of ice. Shore leads (roughly parallel to shore) are evident as bright lines along some shorelines. These are very active areas which typically open and close on a time scale of a few to several hours.
The linear greenish-blue lake effect cloud bands in Lake Superior and Lake Michigan are boundary layer rolls, manifestations of boundary layer convection cells. They are relatively common features over Lakes Superior and Michigan in the winter under consistent northwesterlies, and are good lake effect snow producers. Because they require open water to form, they indicate that there are leads or expanses of open water under and slightly upstream of their northwest ends. Intermittent clear images in the time series reveal a persistent open water area (polynya) in eastern Lake Superior, beneath (and source of) these lake effect cloud bands.
The translucent blue haze in the southern regions is thin, non- lake effect clouds.
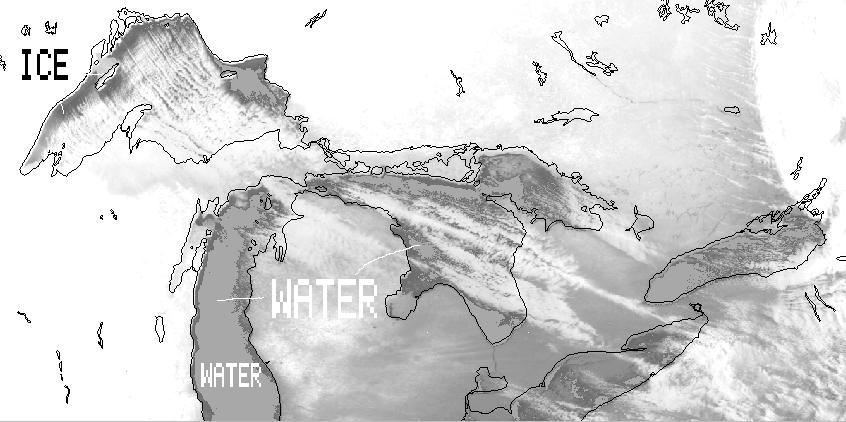
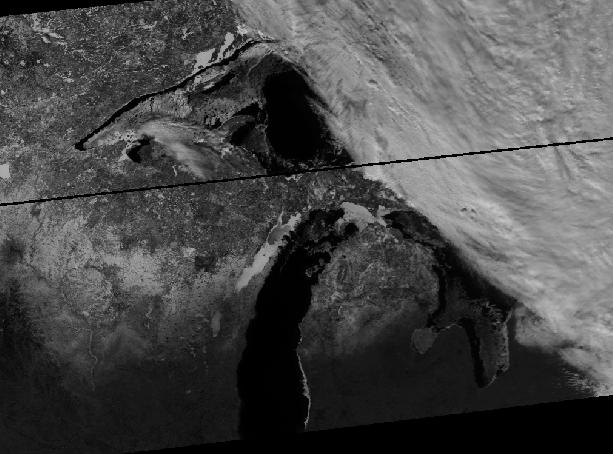
It is difficult to establish a comprehensive chronology of freeze up for all five lakes due to cloud cover. Comparison of Figures 2 (before freeze up) and 3 (after freeze up) yields a rough sense of timing. Figure 2 (January 28) shows temperature distribution over the lakes. Most of Lake Michigan and Ontario are unfrozen. Much of Lakes Huron and Erie and most of Lake Superior have ice cover. By February 2 (not shown), the lakes appear very similar to Figure 1, signalling the onset of maximum ice cover. Figure 3 (February 24) is a visible light image. Lake Michigan is mostly unfrozen, with ice concentrated along the eastern shore, in bays, and concentrated in the north approaching the Straits of Mackinac. Lake Huron ice consists of essentially two large floes separated from the western shore by a shore lead. Eastern Lake Huron and Georgian Bay are obscured by clouds. Lake Superior's western basin supports several large floes, separated from the north shore by a 15 km shore lead. The eastern basin is mostly open water.
The white to dark transition on in central Wisconsin and Michigan is the snow line.
![]() Figure 2. Temperature image
Figure 2 caption
Figure 2. Temperature image
Figure 2 caption
![]() Figure 3. Visible light image.
Figure 3 caption
Figure 3. Visible light image.
Figure 3 caption
For additional information and imagery, please visit the author's web page at http://www.geo.mtu.edu/great_lakes/ice.
Remote Sensing of Great Lakes Snow and Ice Page
Geo Dept.
Great Lakes Snow and Ice Web Page
Passive Micro wave Movie and
Images of Great Lakes Ice
Close-range photos
of Lake Superior ice
(Huge
version of the Feb 4 image(720 kb))